|
Download Data (XLS File) |
|
||||||||
|
||||||||
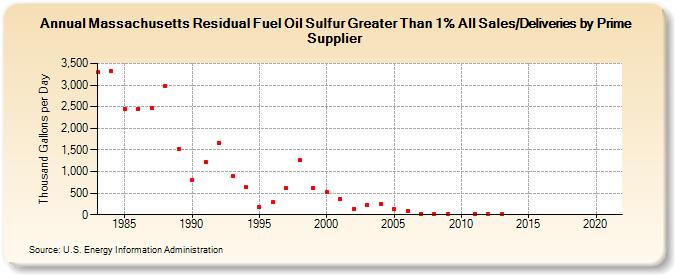
| Massachusetts Residual Fuel Oil Sulfur Greater Than 1% All Sales/Deliveries by Prime Supplier (Thousand Gallons per Day) | ||||||||
| Decade | Year-0 | Year-1 | Year-2 | Year-3 | Year-4 | Year-5 | Year-6 | Year-7 | Year-8 | Year-9 |
|---|---|---|---|---|---|---|---|---|---|---|
| 1980's | 3,296.3 | 3,314.6 | 2,449.3 | 2,456.6 | 2,466.2 | 2,989.8 | 1,517.7 | |||
| 1990's | 804.4 | 1,230.4 | 1,663.3 | 897.6 | 632.0 | 179.0 | 285.3 | 611.2 | 1,255.9 | 627.7 |
| 2000's | 514.6 | 359.1 | 142.4 | 226.8 | 245.3 | 121.9 | 75.7 | 21.5 | 17.4 | 15.7 |
| 2010's | W | 17.8 | 6.9 | 5.7 | W | W | W | W | W | W |
| 2020's | W |
| - = No Data Reported; -- = Not Applicable; NA = Not Available; W = Withheld to avoid disclosure of individual company data. |
| Release Date: 6/1/2022 |
| Next Release Date: TBD |