|
Download Data (XLS File) |
|
||||||||
|
||||||||
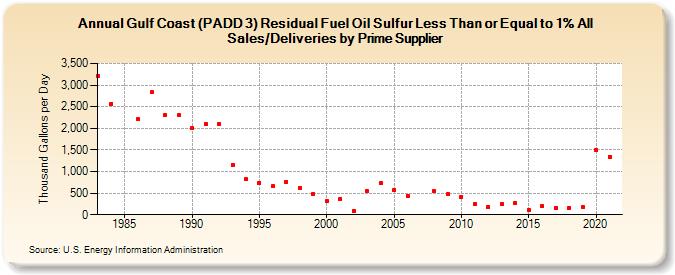
| Gulf Coast (PADD 3) Residual Fuel Oil Sulfur Less Than or Equal to 1% All Sales/Deliveries by Prime Supplier (Thousand Gallons per Day) | ||||||||
| Decade | Year-0 | Year-1 | Year-2 | Year-3 | Year-4 | Year-5 | Year-6 | Year-7 | Year-8 | Year-9 |
|---|---|---|---|---|---|---|---|---|---|---|
| 1980's | 3,216.7 | 2,571.8 | W | 2,203.6 | 2,832.1 | 2,309.8 | 2,310.4 | |||
| 1990's | 2,003.0 | 2,098.6 | 2,103.1 | 1,152.5 | 819.8 | 743.9 | 655.3 | 767.3 | 625.2 | 475.2 |
| 2000's | 310.2 | 367.1 | 88.9 | 537.9 | 723.5 | 562.2 | 439.8 | W | 547.5 | 477.5 |
| 2010's | 417.8 | 246.9 | 183.7 | 248.4 | 280.0 | 112.4 | 196.7 | 164.3 | 166.0 | 182.2 |
| 2020's | 1,501.1 |
| - = No Data Reported; -- = Not Applicable; NA = Not Available; W = Withheld to avoid disclosure of individual company data. |
| Release Date: 6/1/2022 |
| Next Release Date: TBD |