|
Download Data (XLS File) |
|
||||||||
|
||||||||
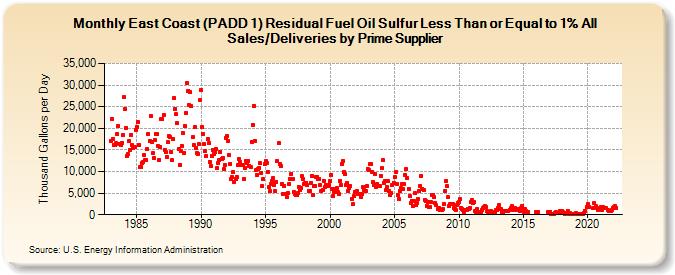
| East Coast (PADD 1) Residual Fuel Oil Sulfur Less Than or Equal to 1% All Sales/Deliveries by Prime Supplier (Thousand Gallons per Day) | ||||||||
| Year | Jan | Feb | Mar | Apr | May | Jun | Jul | Aug | Sep | Oct | Nov | Dec |
|---|---|---|---|---|---|---|---|---|---|---|---|---|
| 1983 | 17,117.7 | 22,181.0 | 17,488.0 | 16,243.8 | 16,080.8 | 16,495.9 | 18,601.2 | 20,517.8 | 16,291.9 | 16,213.6 | 16,542.6 | 18,493.4 |
| 1984 | 27,208.5 | 24,386.2 | 20,174.7 | 13,571.8 | 13,941.2 | 17,019.2 | 14,994.2 | 18,463.3 | 16,040.5 | 15,511.6 | 15,662.0 | 19,625.6 |
| 1985 | 20,402.3 | 21,455.9 | 16,231.5 | 11,000.5 | 11,153.8 | 11,954.7 | 12,195.2 | 13,796.4 | 12,592.2 | 12,617.0 | 15,195.6 | 18,674.8 |
| 1986 | 17,008.7 | 22,772.1 | 16,935.9 | 14,177.7 | 13,186.6 | 17,326.0 | 18,792.3 | 18,565.9 | 15,894.7 | 12,763.2 | 15,778.7 | 22,242.3 |
| 1987 | 22,203.2 | 23,088.6 | 15,089.6 | 14,566.0 | 13,418.3 | 16,762.3 | 18,216.9 | 18,056.5 | 14,586.0 | 12,579.4 | 17,522.6 | 27,048.9 |
| 1988 | 24,524.2 | 23,193.4 | 21,158.6 | 15,242.9 | 11,569.3 | 14,759.1 | 15,911.8 | 18,903.2 | 14,362.3 | 20,456.4 | 23,539.0 | 30,474.9 |
| 1989 | 28,720.0 | 25,292.2 | 28,430.9 | 25,063.5 | 17,983.9 | 16,137.3 | 20,184.8 | 15,551.2 | 14,300.2 | 14,114.4 | 16,266.6 | 26,452.9 |
| 1990 | 28,901.3 | 20,349.0 | 18,696.5 | 16,253.4 | 14,720.9 | 13,577.5 | 17,502.8 | 16,581.4 | 12,273.0 | 11,306.8 | 13,648.6 | 15,048.5 |
| 1991 | 14,087.3 | 14,451.9 | 15,210.7 | 10,902.3 | 11,982.9 | 12,598.7 | 14,528.3 | 12,990.9 | 13,228.3 | 10,518.9 | 11,509.9 | 17,816.6 |
| 1992 | 18,193.7 | 17,132.5 | 13,846.4 | 11,819.1 | 8,165.4 | 8,777.4 | 9,869.7 | 7,618.8 | 8,349.6 | 8,792.0 | 11,443.7 | 12,907.8 |
| 1993 | 12,220.3 | 11,617.8 | 11,536.7 | 11,555.7 | 8,338.6 | 10,884.4 | 12,447.5 | 12,079.5 | 12,439.3 | 11,360.6 | 11,097.2 | 16,918.1 |
| 1994 | 20,875.1 | 25,246.9 | 17,154.5 | 10,320.0 | 9,293.3 | 10,652.6 | 10,766.7 | 11,875.9 | 9,575.1 | 6,668.8 | 8,237.6 | 11,688.4 |
| 1995 | 12,465.7 | 11,970.5 | 9,952.0 | 6,308.3 | 5,428.5 | 7,152.9 | 7,799.2 | 8,430.3 | 6,968.8 | 5,387.7 | 7,662.0 | 12,369.1 |
| 1996 | 16,536.8 | 11,744.0 | 11,203.4 | 7,217.1 | 4,861.5 | 6,721.2 | 4,743.5 | 4,894.4 | 4,040.6 | 4,976.9 | 7,094.5 | 8,219.7 |
| 1997 | 9,455.2 | 8,380.7 | 5,211.7 | 4,829.1 | 4,547.5 | 4,517.5 | 5,037.7 | 6,468.7 | 5,815.7 | 6,232.3 | 8,901.1 | 8,206.8 |
| 1998 | 7,054.8 | 7,256.4 | 7,423.6 | 6,772.5 | 5,538.3 | 5,448.6 | 7,433.9 | 9,031.9 | 4,662.4 | 6,569.0 | 6,717.8 | 8,741.8 |
| 1999 | 8,793.6 | 8,253.3 | 8,378.3 | 6,832.4 | 5,524.1 | 5,731.5 | 7,826.4 | 6,427.0 | 6,879.6 | 6,747.2 | 6,583.0 | 6,838.0 |
| 2000 | 7,812.8 | 9,153.1 | 5,969.7 | 4,351.5 | 5,205.5 | 5,837.8 | 6,106.1 | 5,162.4 | 4,855.6 | 7,763.5 | 6,934.3 | 11,658.7 |
| 2001 | 12,456.5 | 9,956.0 | 9,359.0 | 6,972.1 | 7,399.9 | 5,405.4 | 6,255.1 | 6,624.3 | 3,613.3 | 2,409.1 | 4,215.7 | 5,294.8 |
| 2002 | 5,321.6 | 5,524.1 | 4,680.4 | 4,791.1 | 4,715.8 | 4,160.9 | 4,757.5 | 6,474.9 | 5,741.8 | 5,460.6 | 6,548.0 | 10,654.3 |
| 2003 | 10,331.0 | 11,679.6 | 11,824.1 | 9,956.0 | 7,512.1 | 6,772.8 | 9,362.6 | 6,422.5 | 7,171.5 | 6,732.5 | 6,544.4 | 9,029.0 |
| 2004 | 10,856.4 | 12,597.2 | 7,323.7 | 7,717.3 | 5,628.3 | 6,505.1 | 7,759.6 | 5,435.4 | 4,515.9 | 5,031.3 | 6,960.5 | 7,438.3 |
| 2005 | 8,614.4 | 9,828.1 | 7,161.4 | 4,618.3 | 3,601.0 | 5,522.3 | 6,162.8 | 7,209.7 | 5,981.9 | 7,016.3 | 9,180.3 | 10,514.0 |
| 2006 | 8,460.5 | 6,064.6 | 4,380.7 | 2,724.6 | 3,262.5 | 2,023.6 | 3,254.2 | 4,982.5 | 2,256.7 | 2,816.0 | 3,582.3 | 5,507.5 |
| 2007 | 6,616.2 | 8,898.9 | 6,054.8 | 5,737.0 | 3,487.3 | 3,119.5 | 2,008.3 | 2,857.3 | 1,670.5 | 1,814.4 | 2,839.3 | 4,473.8 |
| 2008 | 4,529.9 | 4,020.1 | 2,750.1 | 2,159.3 | 1,317.5 | 1,637.6 | 1,182.1 | 1,089.5 | 1,201.4 | 1,313.1 | 2,407.9 | 5,540.6 |
| 2009 | 7,784.0 | 6,560.4 | 4,021.0 | 1,994.6 | 2,400.5 | 2,392.3 | 2,375.0 | 1,555.0 | 1,396.5 | 989.9 | 2,294.0 | 2,799.4 |
| 2010 | 2,828.2 | 3,543.9 | 1,664.8 | 1,357.6 | 1,058.7 | 700.5 | 1,164.0 | 1,042.2 | 1,420.8 | 1,343.5 | 1,614.6 | 2,954.3 |
| 2011 | 3,301.8 | 2,639.8 | 2,949.9 | 951.2 | 552.3 | 1,311.8 | 646.0 | 699.0 | 471.0 | 1,128.3 | 1,490.6 | 1,747.2 |
| 2012 | 1,953.7 | 1,744.3 | 849.6 | 624.1 | 726.1 | 534.3 | 749.8 | 718.6 | 395.1 | 471.5 | 1,035.0 | 989.6 |
| 2013 | 1,590.2 | 2,238.5 | 1,377.7 | 1,219.0 | 713.6 | 387.3 | 762.1 | 878.0 | 845.3 | 963.9 | 956.6 | 1,149.7 |
| 2014 | 1,462.7 | 1,938.5 | 1,354.1 | 1,006.4 | 1,457.1 | 1,258.2 | 1,310.9 | 1,173.7 | 1,290.8 | 973.8 | 1,584.4 | 2,069.2 |
| 2015 | 734.0 | 1,220.5 | 891.3 | W | 598.8 | W | W | W | W | W | W | W |
| 2016 | 523.6 | 663.0 | W | W | W | W | W | W | W | W | W | 529.5 |
| 2017 | 446.4 | 647.8 | 219.4 | W | 174.8 | 430.5 | 545.3 | 314.5 | 410.7 | W | 852.3 | 391.6 |
| 2018 | 817.4 | 547.1 | 287.9 | 184.3 | 351.6 | 959.8 | 212.6 | 375.4 | 210.5 | 198.1 | 188.4 | W |
| 2019 | W | 328.3 | 125.9 | 77.0 | 73.6 | 77.2 | 64.5 | 138.7 | 389.5 | 880.9 | W | 1,842.1 |
| 2020 | 2,457.1 | 1,881.1 | W | W | W | 1,456.2 | 2,611.5 | 1,924.1 | 1,610.0 | 1,163.1 | 1,337.2 | 1,217.9 |
| 2021 | 1,808.6 | 1,096.3 | 1,690.4 | 1,489.0 | W | 1,466.8 | W | 1,011.5 | 901.7 | 909.6 | 1,176.4 | 1,665.5 |
| 2022 | 1,749.5 | 1,947.1 | 1,666.7 | |||||||||
| - = No Data Reported; -- = Not Applicable; NA = Not Available; W = Withheld to avoid disclosure of individual company data. |
| Release Date: 5/19/2022 |
| Next Release Date: TBD |