|
Download Data (XLS File) |
|
||||||||
|
||||||||
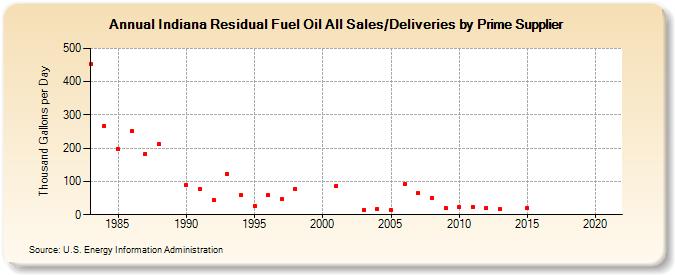
| Indiana Residual Fuel Oil All Sales/Deliveries by Prime Supplier (Thousand Gallons per Day) | ||||||||
| Decade | Year-0 | Year-1 | Year-2 | Year-3 | Year-4 | Year-5 | Year-6 | Year-7 | Year-8 | Year-9 |
|---|---|---|---|---|---|---|---|---|---|---|
| 1980's | 452.0 | 267.4 | 196.8 | 252.1 | 182.8 | 212.2 | W | |||
| 1990's | 88.0 | 78.6 | 45.7 | 121.7 | 57.8 | 27.3 | 59.0 | 46.6 | 77.4 | W |
| 2000's | W | 87.3 | W | 14.4 | 17.1 | 13.7 | 91.2 | 65.4 | 51.0 | 21.2 |
| 2010's | 21.8 | 24.5 | 21.6 | 17.2 | W | 20.2 | W | W | W | W |
| 2020's | W |
| - = No Data Reported; -- = Not Applicable; NA = Not Available; W = Withheld to avoid disclosure of individual company data. |
| Release Date: 6/1/2022 |
| Next Release Date: TBD |