|
Download Data (XLS File) |
|
||||||||
|
||||||||
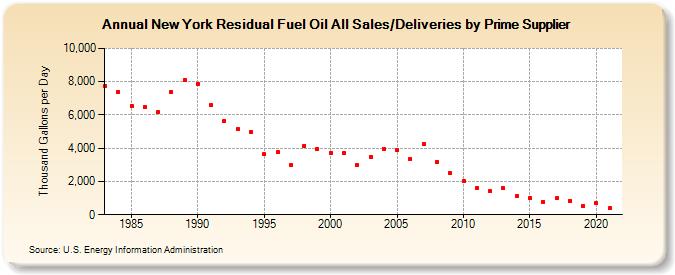
| New York Residual Fuel Oil All Sales/Deliveries by Prime Supplier (Thousand Gallons per Day) | ||||||||
| Decade | Year-0 | Year-1 | Year-2 | Year-3 | Year-4 | Year-5 | Year-6 | Year-7 | Year-8 | Year-9 |
|---|---|---|---|---|---|---|---|---|---|---|
| 1980's | 7,761.5 | 7,399.5 | 6,554.3 | 6,456.5 | 6,170.6 | 7,401.5 | 8,114.1 | |||
| 1990's | 7,883.2 | 6,596.9 | 5,664.3 | 5,158.6 | 4,989.8 | 3,631.1 | 3,769.8 | 2,985.6 | 4,149.8 | 3,965.6 |
| 2000's | 3,734.9 | 3,720.6 | 2,975.2 | 3,497.4 | 3,960.7 | 3,861.3 | 3,362.1 | 4,240.6 | 3,175.6 | 2,493.0 |
| 2010's | 2,020.0 | 1,620.5 | 1,398.4 | 1,586.3 | 1,109.1 | 980.8 | 780.3 | 982.7 | 842.2 | 528.1 |
| 2020's | 685.5 |
| - = No Data Reported; -- = Not Applicable; NA = Not Available; W = Withheld to avoid disclosure of individual company data. |
| Release Date: 6/1/2022 |
| Next Release Date: TBD |