|
Download Data (XLS File) |
|
||||||||
|
||||||||
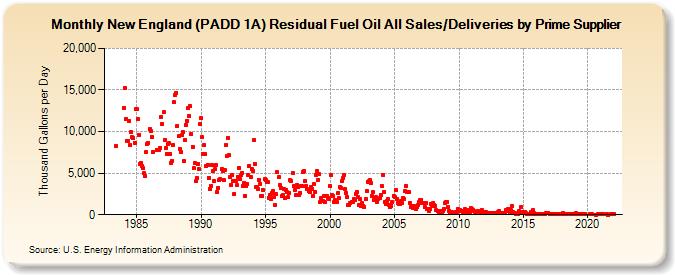
| New England (PADD 1A) Residual Fuel Oil All Sales/Deliveries by Prime Supplier (Thousand Gallons per Day) | ||||||||
| Year | Jan | Feb | Mar | Apr | May | Jun | Jul | Aug | Sep | Oct | Nov | Dec |
|---|---|---|---|---|---|---|---|---|---|---|---|---|
| 1983 | W | W | W | W | W | 8,288.0 | W | W | W | W | W | W |
| 1984 | 12,837.8 | 15,276.3 | 11,521.4 | 8,899.9 | 8,845.7 | 11,320.6 | 8,380.0 | 9,926.6 | 9,305.6 | 9,242.4 | 8,656.7 | 12,671.2 |
| 1985 | 12,721.2 | 11,481.1 | 9,580.0 | 6,106.5 | 6,259.6 | 5,853.0 | 5,582.5 | 4,975.0 | 4,650.7 | 7,526.8 | 8,529.9 | 8,632.3 |
| 1986 | 10,287.9 | 10,056.9 | 9,399.5 | 7,513.3 | W | W | W | 7,828.5 | W | 7,835.3 | 8,040.6 | 11,768.5 |
| 1987 | 10,954.4 | 12,303.9 | 9,004.5 | 7,982.9 | 7,341.5 | 8,446.3 | 8,573.2 | 7,345.1 | 6,274.1 | 6,517.6 | 8,382.1 | 13,506.4 |
| 1988 | 14,425.9 | 14,664.9 | 10,658.0 | 9,406.2 | 7,923.7 | 7,527.6 | 9,575.9 | 9,888.5 | 6,417.0 | 8,981.0 | 10,829.8 | 11,309.6 |
| 1989 | 12,800.2 | 11,923.3 | 13,027.5 | 9,701.5 | 8,175.8 | 5,578.8 | 6,253.8 | 4,007.3 | 4,438.1 | 6,118.6 | 5,492.6 | 10,869.9 |
| 1990 | 11,645.0 | 9,304.8 | 7,343.4 | 8,408.3 | 7,291.3 | 5,900.1 | 6,036.1 | 4,474.9 | 3,148.7 | 3,484.8 | 5,963.2 | 5,246.0 |
| 1991 | 4,032.6 | 5,486.4 | 5,964.1 | 2,696.2 | 3,225.0 | 4,166.3 | 4,237.5 | 5,475.5 | 5,206.9 | 4,180.0 | 5,367.3 | 8,365.6 |
| 1992 | 7,059.6 | 9,281.1 | 7,131.8 | 4,575.5 | 3,624.0 | 4,739.2 | 4,021.5 | 2,542.2 | 4,031.4 | 3,528.8 | 4,569.6 | 5,669.3 |
| 1993 | 4,329.5 | 4,779.2 | 5,069.3 | 3,459.1 | 3,837.4 | 2,266.1 | 3,493.6 | 3,692.0 | 4,743.2 | 5,889.4 | 4,583.7 | 5,457.0 |
| 1994 | 5,292.8 | 8,931.2 | 6,116.0 | 3,388.6 | 3,288.6 | 3,093.3 | 4,229.1 | 3,653.2 | 2,240.5 | 2,281.3 | 2,924.5 | 4,253.0 |
| 1995 | 4,183.2 | 3,918.9 | 3,931.0 | 2,024.7 | 2,402.3 | 1,856.6 | 2,645.2 | 2,798.3 | 2,109.1 | 1,146.9 | 2,519.2 | 5,092.3 |
| 1996 | 4,530.7 | 3,589.0 | 3,262.6 | 2,235.8 | 2,345.6 | 3,062.4 | 1,968.7 | 3,007.6 | 2,696.8 | 2,091.6 | 2,604.2 | 4,143.3 |
| 1997 | 4,070.4 | 4,998.5 | 3,448.8 | 2,976.9 | 2,330.9 | 3,611.9 | 3,337.6 | 2,416.0 | 2,663.8 | 3,485.5 | 3,446.6 | 5,180.1 |
| 1998 | 5,219.1 | 4,009.7 | 3,431.7 | 3,058.7 | 2,850.5 | 2,722.9 | 3,328.5 | 3,127.3 | 2,305.4 | 3,722.1 | 2,722.6 | 4,779.6 |
| 1999 | 5,270.9 | 4,228.4 | 4,840.8 | 1,580.7 | 2,009.1 | 1,702.1 | 2,199.1 | 1,568.9 | 2,290.9 | 2,200.1 | 2,053.6 | 1,893.3 |
| 2000 | 3,463.1 | 4,729.8 | 2,369.4 | 2,269.9 | 1,540.9 | 1,799.4 | 1,483.1 | 2,585.9 | 2,015.8 | 3,353.7 | 3,224.5 | 4,028.3 |
| 2001 | 4,426.5 | 4,718.0 | 3,058.9 | 2,621.0 | 2,094.4 | 1,165.5 | 1,218.7 | 1,441.5 | 1,571.9 | 1,553.7 | 1,835.5 | 1,817.1 |
| 2002 | 2,492.3 | 2,755.6 | 2,092.1 | 1,171.3 | 1,847.0 | 1,087.0 | 1,397.8 | 1,087.6 | 869.1 | 1,852.0 | 2,858.0 | 3,983.1 |
| 2003 | 4,009.7 | 4,153.2 | 3,822.1 | 2,248.0 | 2,676.8 | 1,785.6 | 1,871.9 | 2,095.8 | 1,480.6 | 1,913.9 | 1,953.6 | 2,393.4 |
| 2004 | 3,456.5 | 4,787.7 | 2,714.5 | 1,569.5 | 1,233.8 | 1,688.1 | 1,859.3 | 1,174.4 | 874.6 | 1,093.8 | 1,527.6 | 2,253.8 |
| 2005 | 2,172.9 | 3,027.8 | 1,864.9 | 1,388.1 | 1,326.0 | 1,264.5 | 1,665.8 | 1,436.5 | 2,033.9 | 1,839.0 | 2,826.1 | 3,431.8 |
| 2006 | 2,714.4 | 2,688.0 | 1,419.0 | 974.8 | 1,039.1 | 848.2 | 998.2 | 874.2 | 703.4 | 945.9 | 1,221.2 | 1,563.2 |
| 2007 | 1,720.9 | 1,804.1 | 1,420.6 | 1,444.6 | 984.1 | 1,407.2 | 696.5 | 699.7 | 484.2 | 677.7 | 1,327.0 | 1,049.8 |
| 2008 | 1,448.1 | 1,172.2 | 1,062.7 | 550.2 | 395.0 | 378.0 | 361.2 | 398.7 | 372.3 | 454.9 | 706.5 | 1,352.7 |
| 2009 | 1,566.2 | 1,579.3 | 974.1 | 473.0 | 249.8 | 322.1 | 244.8 | 233.4 | 258.1 | 306.5 | 331.5 | 746.1 |
| 2010 | 593.3 | 609.0 | 390.5 | 433.6 | 362.1 | 350.5 | 629.5 | 344.2 | 332.2 | 551.5 | 378.5 | 792.4 |
| 2011 | 732.4 | 557.6 | 443.2 | 377.4 | 371.4 | 246.3 | 454.5 | 285.8 | 318.0 | 623.5 | 262.5 | 287.8 |
| 2012 | 368.8 | 353.0 | 220.7 | 232.3 | 205.5 | 232.7 | 208.8 | 264.5 | 166.3 | 154.1 | 258.3 | 232.2 |
| 2013 | 276.6 | 423.3 | 196.5 | 233.0 | 251.8 | 234.6 | 257.8 | 209.2 | 538.5 | 397.0 | 728.1 | 381.6 |
| 2014 | 532.4 | 1,018.8 | 324.6 | 151.9 | 193.5 | 145.7 | 121.5 | 106.4 | 417.0 | 203.5 | 923.2 | 288.2 |
| 2015 | 286.8 | 337.7 | 200.3 | 114.7 | 88.6 | 125.0 | 56.8 | 329.2 | 109.4 | 535.0 | 162.0 | 84.5 |
| 2016 | 100.7 | 120.7 | 87.3 | 58.5 | 90.4 | 98.0 | 50.3 | 74.0 | 83.7 | 175.6 | W | 208.0 |
| 2017 | W | 141.6 | 62.6 | 29.0 | 46.4 | 59.1 | 44.9 | 41.5 | 29.5 | 116.1 | 94.2 | 94.8 |
| 2018 | W | 159.1 | 46.3 | 60.8 | 109.5 | 58.8 | 30.8 | 36.9 | 26.6 | 63.1 | 68.1 | 86.5 |
| 2019 | 84.7 | 162.0 | 70.8 | 55.1 | 57.1 | 35.0 | 41.5 | 51.1 | W | 83.4 | W | W |
| 2020 | W | W | 43.8 | W | 31.8 | W | W | 12.2 | W | 52.6 | 48.9 | W |
| 2021 | 59.1 | W | 55.4 | W | W | W | 33.7 | 22.8 | W | 33.0 | 59.5 | W |
| 2022 | 119.6 | W | W | |||||||||
| - = No Data Reported; -- = Not Applicable; NA = Not Available; W = Withheld to avoid disclosure of individual company data. |
| Release Date: 5/19/2022 |
| Next Release Date: TBD |