|
Download Data (XLS File) |
|
||||||||
|
||||||||
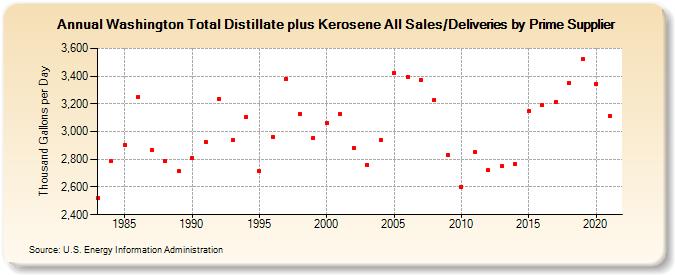
| Washington Total Distillate plus Kerosene All Sales/Deliveries by Prime Supplier (Thousand Gallons per Day) | ||||||||
| Decade | Year-0 | Year-1 | Year-2 | Year-3 | Year-4 | Year-5 | Year-6 | Year-7 | Year-8 | Year-9 |
|---|---|---|---|---|---|---|---|---|---|---|
| 1980's | 2,520.2 | 2,785.9 | 2,904.2 | 3,252.2 | 2,867.5 | 2,786.9 | 2,715.1 | |||
| 1990's | 2,809.6 | 2,927.5 | 3,237.6 | 2,937.7 | 3,104.3 | 2,712.0 | 2,962.4 | 3,379.6 | 3,129.2 | 2,954.1 |
| 2000's | 3,061.3 | 3,126.3 | 2,881.4 | 2,762.0 | 2,939.5 | 3,425.6 | 3,396.2 | 3,374.4 | 3,231.2 | 2,832.3 |
| 2010's | 2,602.9 | 2,852.8 | 2,721.0 | 2,749.7 | 2,766.6 | 3,145.8 | 3,188.8 | 3,213.7 | 3,353.9 | 3,521.6 |
| 2020's | 3,345.1 |
| - = No Data Reported; -- = Not Applicable; NA = Not Available; W = Withheld to avoid disclosure of individual company data. |
| Release Date: 6/1/2022 |
| Next Release Date: TBD |