|
Download Data (XLS File) |
|
||||||||
|
||||||||
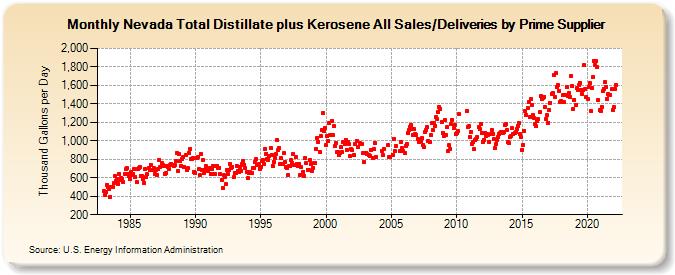
| Nevada Total Distillate plus Kerosene All Sales/Deliveries by Prime Supplier (Thousand Gallons per Day) | ||||||||
| Year | Jan | Feb | Mar | Apr | May | Jun | Jul | Aug | Sep | Oct | Nov | Dec |
|---|---|---|---|---|---|---|---|---|---|---|---|---|
| 1983 | 452.7 | 418.0 | 444.2 | 523.6 | 496.6 | 476.5 | 395.0 | 505.1 | 497.1 | 539.2 | 619.0 | 563.7 |
| 1984 | 584.1 | 535.8 | 645.2 | 575.8 | 600.1 | 591.7 | 548.8 | 640.6 | 692.7 | 701.9 | 635.8 | 618.3 |
| 1985 | 585.4 | 663.8 | 625.7 | 639.6 | 694.9 | 610.5 | 554.5 | 698.5 | 703.0 | 717.5 | 623.8 | 623.7 |
| 1986 | 581.6 | 544.6 | 696.8 | 605.1 | 637.0 | 703.8 | 685.3 | 741.5 | 687.4 | 687.5 | 703.3 | 642.8 |
| 1987 | 686.9 | 633.9 | 693.5 | 794.8 | 720.3 | 763.4 | 736.1 | 732.2 | 642.7 | 654.7 | 726.0 | 716.9 |
| 1988 | 689.6 | 733.0 | 753.8 | 735.9 | 728.9 | 734.8 | 783.6 | 870.5 | 671.2 | 860.9 | 783.1 | 728.6 |
| 1989 | 806.5 | 827.3 | 714.5 | 846.7 | 684.9 | 704.8 | 872.5 | 909.7 | 798.2 | 807.2 | 811.3 | 662.6 |
| 1990 | 650.5 | 818.7 | 820.7 | 689.9 | 625.6 | 860.8 | 682.5 | 787.9 | 653.5 | 688.6 | 724.2 | 691.9 |
| 1991 | 678.1 | 700.2 | 637.6 | 692.7 | 730.9 | 643.6 | 643.3 | 725.2 | 728.4 | 709.4 | 709.6 | 636.7 |
| 1992 | 579.5 | 490.2 | 626.9 | 605.9 | 527.2 | 685.2 | 646.0 | 687.2 | 746.6 | 703.1 | 721.6 | 604.2 |
| 1993 | 650.8 | 646.7 | 730.3 | 669.3 | 663.2 | 715.0 | 673.4 | 748.3 | 782.7 | 740.8 | 703.7 | 659.5 |
| 1994 | 592.9 | 655.6 | 664.5 | 646.5 | 653.6 | 700.9 | 704.5 | 767.7 | 799.1 | 736.2 | 744.7 | 697.9 |
| 1995 | 717.8 | 778.3 | 795.1 | 752.3 | 912.0 | 860.3 | 807.1 | 796.1 | 830.9 | 926.2 | 845.4 | 731.3 |
| 1996 | 775.3 | 808.5 | 856.5 | 1,010.1 | 896.4 | 923.0 | 753.0 | 811.0 | 751.7 | 862.9 | 772.3 | 719.6 |
| 1997 | 705.9 | 629.5 | 722.3 | 724.4 | 792.8 | 761.5 | 854.6 | 733.3 | 824.6 | 747.8 | 721.8 | 750.0 |
| 1998 | 626.5 | 714.0 | W | 665.4 | 621.6 | 817.0 | 755.3 | 687.2 | 682.0 | 795.6 | 749.3 | 675.3 |
| 1999 | 710.1 | 759.0 | 759.5 | 910.2 | 1,035.4 | 991.7 | 879.8 | 1,052.6 | 1,116.4 | 1,296.8 | 1,105.0 | 1,143.5 |
| 2000 | 951.7 | 1,049.6 | 994.3 | 1,193.3 | 1,060.6 | 1,218.4 | 1,065.2 | 1,161.5 | 939.5 | 980.4 | 874.2 | 876.3 |
| 2001 | 845.5 | 871.2 | 931.0 | 878.2 | 985.7 | 960.9 | 1,011.8 | 905.5 | 989.4 | 961.2 | 831.4 | 907.7 |
| 2002 | 895.3 | W | 845.4 | 969.7 | 1,000.2 | 934.5 | W | 971.3 | 960.2 | 970.2 | 870.5 | 774.9 |
| 2003 | W | 871.4 | 854.1 | 850.9 | 838.5 | 901.3 | W | 817.4 | 907.6 | 974.6 | 826.6 | W |
| 2004 | W | W | W | 887.4 | 847.4 | 913.2 | W | W | W | 949.3 | 826.2 | 819.9 |
| 2005 | W | 850.6 | 1,024.5 | 894.0 | 942.1 | W | W | W | 885.8 | 990.1 | 921.7 | 889.7 |
| 2006 | 867.9 | 948.3 | 963.2 | 1,084.2 | 1,114.2 | 1,152.4 | 1,175.5 | 1,130.8 | 1,063.7 | 1,126.2 | 1,076.8 | 1,064.0 |
| 2007 | 1,021.1 | 988.0 | 1,012.7 | 994.0 | 1,026.1 | 952.8 | 930.7 | 1,094.4 | 1,117.7 | 1,149.2 | 1,001.5 | 987.9 |
| 2008 | 1,058.3 | 1,189.3 | 1,117.1 | 1,188.2 | 1,163.4 | 1,256.2 | 1,232.3 | 1,306.8 | 1,367.7 | 1,347.9 | 1,204.9 | 1,087.3 |
| 2009 | 1,047.6 | 1,230.0 | 1,068.1 | 1,148.0 | 890.4 | 951.6 | 911.3 | 1,181.5 | 1,226.4 | 1,136.5 | 1,174.4 | 1,068.5 |
| 2010 | 1,089.4 | 1,110.1 | 1,286.3 | NA | NA | NA | NA | NA | NA | 1,321.9 | 1,151.8 | 1,155.2 |
| 2011 | 1,042.1 | 1,098.1 | 966.3 | 983.2 | 908.2 | 1,008.4 | 1,022.4 | 1,036.2 | 1,145.1 | 1,129.3 | 1,186.4 | 1,088.9 |
| 2012 | 988.6 | 1,012.3 | 1,088.0 | 1,054.7 | 1,075.3 | 1,061.9 | 990.6 | 1,071.5 | 1,117.8 | 1,073.6 | 1,018.6 | 918.4 |
| 2013 | 969.6 | 1,006.0 | 1,039.5 | 1,070.9 | 1,079.9 | 1,093.9 | 1,086.2 | 1,099.6 | 1,172.1 | 1,177.5 | 1,116.2 | 987.3 |
| 2014 | 973.4 | 1,039.3 | 1,050.4 | 1,133.1 | 1,071.2 | 1,081.6 | 1,092.5 | 1,131.8 | 1,165.0 | 1,195.2 | 1,068.2 | 1,038.6 |
| 2015 | 903.7 | 959.6 | 1,109.8 | 1,320.5 | 1,281.8 | 1,354.6 | 1,419.7 | 1,260.3 | 1,447.4 | 1,390.4 | 1,279.2 | 1,248.5 |
| 2016 | 1,179.5 | 1,156.7 | 1,217.5 | 1,235.3 | 1,313.4 | 1,482.4 | 1,455.2 | 1,463.4 | 1,477.0 | 1,366.0 | 1,240.7 | 1,276.4 |
| 2017 | 1,197.1 | 1,331.4 | 1,412.1 | 1,508.4 | 1,517.8 | 1,709.8 | 1,474.1 | 1,729.2 | 1,580.3 | 1,599.4 | 1,543.1 | 1,423.8 |
| 2018 | 1,429.4 | 1,491.7 | 1,415.4 | 1,491.7 | 1,497.8 | 1,587.3 | 1,484.7 | 1,517.8 | 1,475.7 | 1,702.7 | 1,593.6 | 1,339.3 |
| 2019 | 1,445.9 | 1,388.9 | 1,568.4 | 1,555.0 | 1,603.5 | 1,629.4 | 1,546.5 | 1,509.6 | 1,549.9 | 1,815.6 | 1,562.8 | 1,478.8 |
| 2020 | 1,455.1 | 1,581.3 | 1,623.2 | 1,321.6 | 1,569.5 | 1,687.3 | 1,865.5 | 1,825.5 | 1,862.3 | 1,799.6 | 1,441.7 | 1,335.4 |
| 2021 | 1,318.1 | 1,370.0 | 1,535.1 | 1,565.5 | 1,635.1 | 1,586.7 | 1,455.6 | 1,506.1 | 1,490.4 | 1,496.2 | 1,556.3 | 1,338.3 |
| 2022 | 1,360.7 | 1,564.4 | 1,607.5 | |||||||||
| - = No Data Reported; -- = Not Applicable; NA = Not Available; W = Withheld to avoid disclosure of individual company data. |
| Release Date: 5/19/2022 |
| Next Release Date: TBD |