|
Download Data (XLS File) |
|
||||||||
|
||||||||
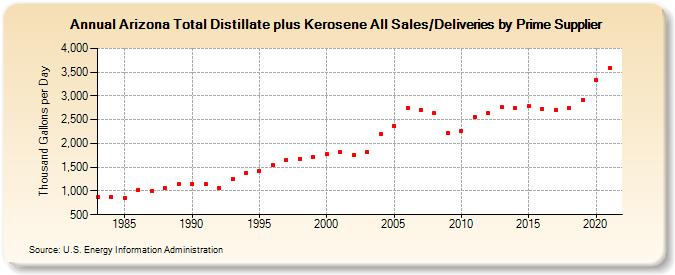
| Arizona Total Distillate plus Kerosene All Sales/Deliveries by Prime Supplier (Thousand Gallons per Day) | ||||||||
| Decade | Year-0 | Year-1 | Year-2 | Year-3 | Year-4 | Year-5 | Year-6 | Year-7 | Year-8 | Year-9 |
|---|---|---|---|---|---|---|---|---|---|---|
| 1980's | 864.8 | 876.6 | 849.9 | 1,023.4 | 1,002.9 | 1,055.5 | 1,138.0 | |||
| 1990's | 1,144.2 | 1,150.9 | 1,068.2 | 1,254.9 | 1,379.6 | 1,422.2 | 1,541.5 | 1,658.9 | 1,679.6 | 1,705.9 |
| 2000's | 1,772.0 | 1,829.8 | 1,759.6 | 1,815.8 | 2,191.2 | 2,369.4 | 2,752.8 | 2,705.3 | 2,631.1 | 2,217.1 |
| 2010's | 2,257.8 | 2,553.6 | 2,631.7 | 2,756.8 | 2,745.9 | 2,783.6 | 2,727.1 | 2,703.0 | 2,745.2 | 2,916.0 |
| 2020's | 3,337.4 |
| - = No Data Reported; -- = Not Applicable; NA = Not Available; W = Withheld to avoid disclosure of individual company data. |
| Release Date: 6/1/2022 |
| Next Release Date: TBD |