|
Download Data (XLS File) |
|
||||||||
|
||||||||
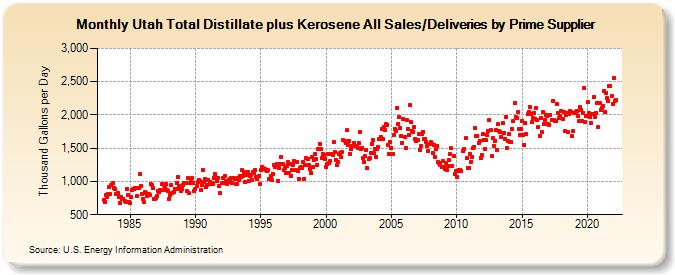
| Utah Total Distillate plus Kerosene All Sales/Deliveries by Prime Supplier (Thousand Gallons per Day) | ||||||||
| Year | Jan | Feb | Mar | Apr | May | Jun | Jul | Aug | Sep | Oct | Nov | Dec |
|---|---|---|---|---|---|---|---|---|---|---|---|---|
| 1983 | 727.0 | 694.8 | 797.8 | 758.8 | 811.0 | 919.5 | 809.3 | 945.2 | 970.6 | 898.9 | 885.1 | 811.4 |
| 1984 | 807.5 | 827.7 | 766.7 | 680.6 | 759.2 | 733.3 | 742.0 | 712.8 | 686.0 | 892.9 | 791.1 | 693.1 |
| 1985 | 682.6 | 759.4 | 871.1 | 887.5 | 880.6 | 900.8 | 775.4 | 897.2 | 908.4 | 1,110.9 | 936.6 | 804.2 |
| 1986 | 738.0 | 687.1 | 845.8 | 822.0 | 781.0 | 804.5 | 797.4 | 960.6 | 940.0 | 897.6 | 735.4 | 737.4 |
| 1987 | 752.1 | 786.7 | 860.5 | 846.7 | 865.3 | 958.7 | 870.5 | 940.3 | 909.2 | 956.2 | 874.2 | 853.7 |
| 1988 | 738.6 | 792.5 | 951.4 | 825.0 | 848.9 | 892.2 | 886.6 | 979.7 | 1,062.9 | 926.0 | 887.9 | 857.8 |
| 1989 | 892.9 | 953.4 | 976.0 | 974.6 | 856.0 | 1,044.7 | 819.5 | 980.4 | 1,006.1 | 1,052.0 | 981.7 | 852.9 |
| 1990 | 890.9 | 929.0 | 988.6 | 1,026.4 | 1,013.6 | 875.3 | 942.3 | 1,172.6 | 987.9 | 1,037.7 | 912.3 | 951.8 |
| 1991 | 1,026.9 | 987.9 | 957.2 | 980.0 | 965.1 | 1,052.5 | 1,107.4 | 1,050.7 | 1,004.9 | 1,054.5 | 927.1 | 819.9 |
| 1992 | 970.6 | 1,051.1 | 970.7 | 1,080.6 | 1,008.3 | 956.4 | 998.0 | 1,029.3 | 1,037.7 | 1,046.6 | 976.0 | 1,050.3 |
| 1993 | 1,033.1 | 955.5 | 957.2 | 1,053.7 | 1,019.2 | 1,080.6 | 1,060.2 | 1,169.7 | 1,089.1 | 1,145.3 | 984.7 | 1,091.4 |
| 1994 | 1,144.7 | 1,012.5 | 1,077.9 | 1,099.0 | 1,019.5 | 1,136.8 | 1,125.3 | 1,172.5 | 1,062.7 | 1,031.5 | 1,086.0 | 958.8 |
| 1995 | 1,173.2 | 1,216.1 | 1,194.7 | 1,191.1 | 1,193.5 | 1,178.4 | 1,162.1 | 1,170.6 | 1,029.8 | 1,078.6 | 1,016.9 | 1,118.8 |
| 1996 | 1,249.1 | 1,217.2 | 1,235.2 | 1,258.8 | 1,005.7 | 1,202.2 | 1,263.2 | 1,360.0 | 1,259.9 | 1,167.9 | 1,199.4 | 1,133.8 |
| 1997 | 1,234.3 | 1,294.9 | 1,132.5 | 1,269.3 | 1,085.1 | 1,171.9 | 1,254.5 | 1,304.7 | 1,167.0 | 1,291.5 | 1,157.4 | 1,042.5 |
| 1998 | 1,205.3 | 1,224.2 | 1,195.7 | 1,289.0 | 1,040.6 | 1,245.8 | 1,346.0 | 1,341.7 | 1,249.3 | 1,187.3 | 1,132.4 | 1,360.6 |
| 1999 | 1,213.0 | 1,322.5 | 1,411.7 | 1,331.1 | 1,251.0 | 1,482.7 | 1,563.7 | 1,491.2 | 1,351.4 | 1,416.6 | 1,395.9 | 1,338.7 |
| 2000 | 1,216.0 | 1,261.0 | 1,419.9 | 1,275.3 | 1,303.6 | 1,407.8 | 1,400.4 | 1,586.1 | 1,440.4 | 1,328.0 | 1,253.2 | 1,298.2 |
| 2001 | 1,414.7 | 1,432.9 | 1,360.4 | 1,436.2 | 1,617.2 | 1,611.8 | 1,581.7 | 1,767.6 | 1,555.2 | 1,612.9 | 1,419.2 | 1,486.7 |
| 2002 | 1,533.9 | 1,528.0 | 1,578.4 | 1,530.7 | 1,529.7 | 1,505.9 | 1,577.5 | 1,737.2 | 1,492.3 | 1,508.8 | 1,356.8 | 1,299.1 |
| 2003 | 1,377.4 | 1,466.5 | 1,195.1 | 1,330.2 | 1,348.6 | 1,434.0 | 1,567.1 | 1,618.8 | 1,422.2 | 1,492.5 | 1,371.0 | 1,482.0 |
| 2004 | 1,510.3 | 1,638.1 | 1,667.4 | 1,794.0 | 1,631.1 | 1,813.1 | 1,775.5 | 1,866.3 | 1,854.9 | 1,549.0 | 1,418.7 | 1,588.1 |
| 2005 | 1,500.6 | 1,411.6 | 1,693.0 | 1,789.6 | 1,761.0 | 2,104.2 | 1,864.1 | 1,972.3 | 1,796.9 | 1,681.9 | 1,572.2 | 1,933.5 |
| 2006 | 1,667.9 | 1,501.6 | 1,927.3 | 1,789.5 | 1,700.0 | 2,155.8 | 1,888.4 | 1,760.8 | 1,744.3 | 1,814.9 | 1,642.8 | 1,602.5 |
| 2007 | 1,617.0 | 1,709.2 | 1,474.9 | 1,529.9 | 1,718.0 | 1,743.7 | 1,643.9 | 1,645.1 | 1,597.8 | 1,533.9 | 1,458.1 | 1,565.3 |
| 2008 | 1,589.9 | 1,566.0 | 1,426.0 | 1,548.3 | 1,369.6 | 1,493.2 | 1,535.6 | 1,288.6 | 1,284.3 | 1,247.5 | 1,224.4 | 1,303.3 |
| 2009 | 1,223.7 | 1,183.7 | 1,282.0 | 1,166.5 | 1,227.0 | 1,322.1 | 1,407.7 | 1,499.1 | 1,238.2 | 1,375.9 | 1,109.5 | 1,155.3 |
| 2010 | 1,059.5 | 1,153.9 | 1,176.2 | 1,172.5 | 1,162.6 | NA | 1,451.8 | 1,483.5 | 1,650.5 | 1,346.5 | 1,208.5 | 1,199.0 |
| 2011 | 1,410.6 | 1,294.9 | 1,371.5 | 1,496.4 | 1,525.1 | 1,801.8 | 1,683.9 | 1,689.0 | 1,584.4 | 1,610.9 | 1,358.0 | 1,400.8 |
| 2012 | 1,708.9 | 1,621.2 | 1,493.9 | 1,616.3 | 1,692.6 | 1,765.2 | 1,919.5 | 1,767.2 | 1,385.4 | 1,647.1 | 1,530.3 | 1,610.9 |
| 2013 | 1,768.9 | 1,479.0 | 1,862.3 | 1,759.1 | 1,739.2 | 1,671.4 | 1,877.0 | 1,726.9 | 1,641.7 | 1,972.4 | 1,500.3 | 1,614.2 |
| 2014 | 1,718.4 | 1,591.9 | 1,598.2 | 1,793.5 | 1,907.6 | 2,172.9 | 1,973.6 | 1,952.7 | 2,043.8 | 1,787.2 | 1,692.0 | 1,783.3 |
| 2015 | 1,915.8 | 1,702.7 | 1,552.6 | 1,881.4 | 1,720.5 | 2,008.0 | 2,050.7 | 2,124.4 | 2,006.5 | 1,887.9 | 1,958.8 | 2,033.4 |
| 2016 | 1,945.0 | 2,107.7 | 1,917.7 | 1,811.7 | 1,686.9 | 1,950.0 | 1,742.3 | 2,042.8 | 1,867.7 | 1,916.7 | 2,004.4 | 1,989.4 |
| 2017 | 1,857.1 | 1,854.2 | 1,997.7 | 1,928.1 | 2,208.0 | 1,918.1 | 1,904.1 | 1,910.1 | 2,160.7 | 2,030.3 | 1,953.1 | 1,981.0 |
| 2018 | 2,060.3 | 1,940.9 | 2,041.2 | 1,750.9 | 1,992.0 | 2,033.4 | 1,742.2 | 2,019.8 | 2,055.8 | 2,037.2 | 1,683.9 | 1,754.4 |
| 2019 | 2,035.0 | 2,049.7 | 2,065.8 | 1,987.9 | 1,905.0 | 2,118.8 | 2,072.3 | 1,909.6 | 2,031.2 | 2,404.1 | 1,891.1 | 1,979.1 |
| 2020 | 2,195.0 | 2,023.7 | 1,965.7 | 1,884.9 | 2,008.2 | 2,012.1 | 2,274.6 | 1,967.2 | 2,032.8 | 2,173.9 | 1,816.2 | 2,184.0 |
| 2021 | 2,076.1 | 2,109.5 | 2,140.5 | 2,352.1 | 2,041.5 | 2,322.2 | 2,253.7 | 2,204.7 | 2,435.4 | 2,427.7 | 2,282.5 | 2,168.2 |
| 2022 | 2,558.9 | 2,205.1 | 2,226.7 | |||||||||
| - = No Data Reported; -- = Not Applicable; NA = Not Available; W = Withheld to avoid disclosure of individual company data. |
| Release Date: 5/19/2022 |
| Next Release Date: TBD |