|
Download Data (XLS File) |
|
||||||||
|
||||||||
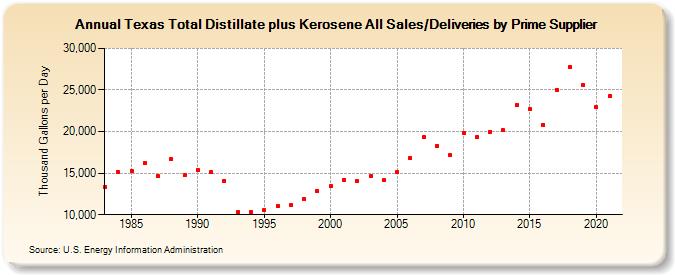
| Texas Total Distillate plus Kerosene All Sales/Deliveries by Prime Supplier (Thousand Gallons per Day) | ||||||||
| Decade | Year-0 | Year-1 | Year-2 | Year-3 | Year-4 | Year-5 | Year-6 | Year-7 | Year-8 | Year-9 |
|---|---|---|---|---|---|---|---|---|---|---|
| 1980's | 13,357.1 | 15,097.3 | 15,310.9 | 16,191.7 | 14,630.0 | 16,646.6 | 14,726.1 | |||
| 1990's | 15,342.6 | 15,081.5 | 14,088.6 | 10,295.8 | 10,299.9 | 10,553.0 | 11,052.5 | 11,164.3 | 11,831.1 | 12,852.7 |
| 2000's | 13,421.5 | 14,200.1 | 14,026.3 | 14,654.2 | 14,132.3 | 15,138.0 | 16,795.3 | 19,298.1 | 18,258.9 | 17,148.2 |
| 2010's | 19,855.7 | 19,310.9 | 19,993.0 | 20,136.3 | 23,219.1 | 22,671.1 | 20,839.4 | 25,014.7 | 27,775.3 | 25,545.3 |
| 2020's | 22,897.9 |
| - = No Data Reported; -- = Not Applicable; NA = Not Available; W = Withheld to avoid disclosure of individual company data. |
| Release Date: 6/1/2022 |
| Next Release Date: TBD |