|
Download Data (XLS File) |
|
||||||||
|
||||||||
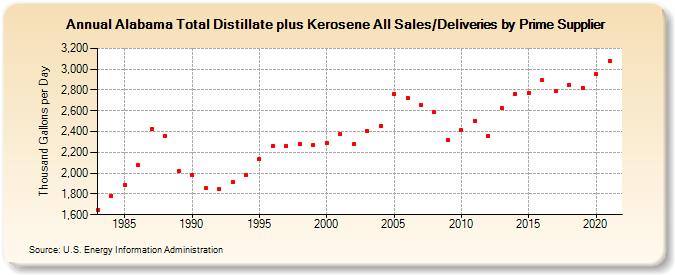
| Alabama Total Distillate plus Kerosene All Sales/Deliveries by Prime Supplier (Thousand Gallons per Day) | ||||||||
| Decade | Year-0 | Year-1 | Year-2 | Year-3 | Year-4 | Year-5 | Year-6 | Year-7 | Year-8 | Year-9 |
|---|---|---|---|---|---|---|---|---|---|---|
| 1980's | 1,647.6 | 1,783.4 | 1,886.4 | 2,073.9 | 2,421.9 | 2,361.7 | 2,020.2 | |||
| 1990's | 1,982.9 | 1,852.7 | 1,844.9 | 1,918.8 | 1,985.2 | 2,136.1 | 2,259.4 | 2,260.3 | 2,279.5 | 2,271.5 |
| 2000's | 2,289.9 | 2,373.4 | 2,277.4 | 2,404.6 | 2,455.2 | 2,762.0 | 2,725.2 | 2,656.4 | 2,586.3 | 2,318.1 |
| 2010's | 2,411.3 | 2,502.8 | 2,357.5 | 2,627.4 | 2,764.6 | 2,775.5 | 2,892.4 | 2,786.5 | 2,850.9 | 2,823.2 |
| 2020's | 2,949.4 |
| - = No Data Reported; -- = Not Applicable; NA = Not Available; W = Withheld to avoid disclosure of individual company data. |
| Release Date: 6/1/2022 |
| Next Release Date: TBD |