|
Download Data (XLS File) |
|
||||||||
|
||||||||
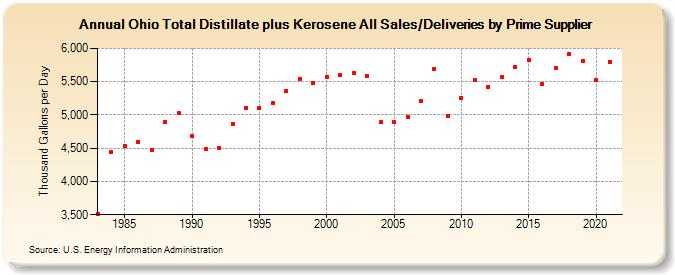
| Ohio Total Distillate plus Kerosene All Sales/Deliveries by Prime Supplier (Thousand Gallons per Day) | ||||||||
| Decade | Year-0 | Year-1 | Year-2 | Year-3 | Year-4 | Year-5 | Year-6 | Year-7 | Year-8 | Year-9 |
|---|---|---|---|---|---|---|---|---|---|---|
| 1980's | 3,506.3 | 4,437.1 | 4,536.1 | 4,598.8 | 4,474.4 | 4,892.9 | 5,022.6 | |||
| 1990's | 4,678.0 | 4,483.7 | 4,503.5 | 4,867.9 | 5,110.5 | 5,107.3 | 5,185.7 | 5,366.9 | 5,535.5 | 5,485.7 |
| 2000's | 5,573.7 | 5,605.6 | 5,634.0 | 5,588.6 | 4,896.1 | 4,893.6 | 4,967.6 | 5,203.1 | 5,683.9 | 4,979.3 |
| 2010's | 5,256.9 | 5,520.3 | 5,418.6 | 5,572.5 | 5,721.4 | 5,818.6 | 5,470.1 | 5,699.0 | 5,908.2 | 5,806.5 |
| 2020's | 5,519.0 |
| - = No Data Reported; -- = Not Applicable; NA = Not Available; W = Withheld to avoid disclosure of individual company data. |
| Release Date: 6/1/2022 |
| Next Release Date: TBD |