|
Download Data (XLS File) |
|
||||||||
|
||||||||
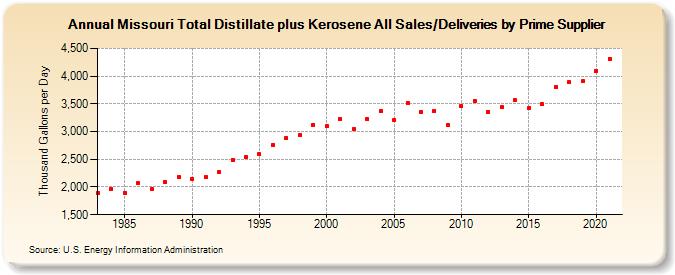
| Missouri Total Distillate plus Kerosene All Sales/Deliveries by Prime Supplier (Thousand Gallons per Day) | ||||||||
| Decade | Year-0 | Year-1 | Year-2 | Year-3 | Year-4 | Year-5 | Year-6 | Year-7 | Year-8 | Year-9 |
|---|---|---|---|---|---|---|---|---|---|---|
| 1980's | 1,899.0 | 1,966.9 | 1,897.0 | 2,065.2 | 1,964.8 | 2,083.7 | 2,177.8 | |||
| 1990's | 2,152.7 | 2,182.1 | 2,264.7 | 2,487.8 | 2,542.6 | 2,590.8 | 2,763.6 | 2,886.2 | 2,939.9 | 3,120.6 |
| 2000's | 3,099.3 | 3,230.0 | 3,043.9 | 3,223.2 | 3,372.9 | 3,212.6 | 3,521.8 | 3,358.2 | 3,378.9 | 3,111.9 |
| 2010's | 3,458.4 | 3,549.7 | 3,358.4 | 3,438.6 | 3,561.1 | 3,419.0 | 3,492.7 | 3,802.3 | 3,885.0 | 3,905.8 |
| 2020's | 4,099.6 |
| - = No Data Reported; -- = Not Applicable; NA = Not Available; W = Withheld to avoid disclosure of individual company data. |
| Release Date: 6/1/2022 |
| Next Release Date: TBD |