|
Download Data (XLS File) |
|
||||||||
|
||||||||
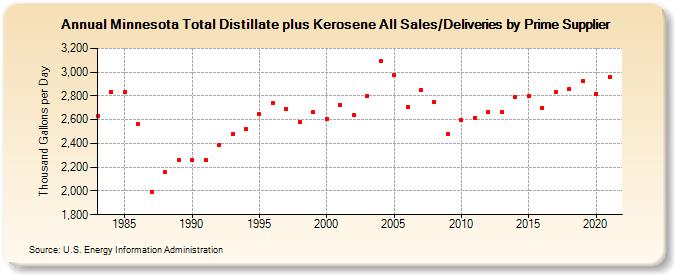
| Minnesota Total Distillate plus Kerosene All Sales/Deliveries by Prime Supplier (Thousand Gallons per Day) | ||||||||
| Decade | Year-0 | Year-1 | Year-2 | Year-3 | Year-4 | Year-5 | Year-6 | Year-7 | Year-8 | Year-9 |
|---|---|---|---|---|---|---|---|---|---|---|
| 1980's | 2,630.9 | 2,835.3 | 2,831.5 | 2,559.8 | 1,992.2 | 2,155.8 | 2,259.2 | |||
| 1990's | 2,260.9 | 2,263.1 | 2,390.4 | 2,478.5 | 2,522.4 | 2,644.7 | 2,738.6 | 2,688.8 | 2,582.6 | 2,661.2 |
| 2000's | 2,608.0 | 2,726.0 | 2,636.1 | 2,799.6 | 3,094.5 | 2,974.0 | 2,709.8 | 2,847.9 | 2,748.8 | 2,481.4 |
| 2010's | 2,597.6 | 2,610.3 | 2,665.8 | 2,667.8 | 2,790.0 | 2,797.9 | 2,699.1 | 2,835.3 | 2,859.5 | 2,924.3 |
| 2020's | 2,819.3 |
| - = No Data Reported; -- = Not Applicable; NA = Not Available; W = Withheld to avoid disclosure of individual company data. |
| Release Date: 6/1/2022 |
| Next Release Date: TBD |