|
Download Data (XLS File) |
|
||||||||
|
||||||||
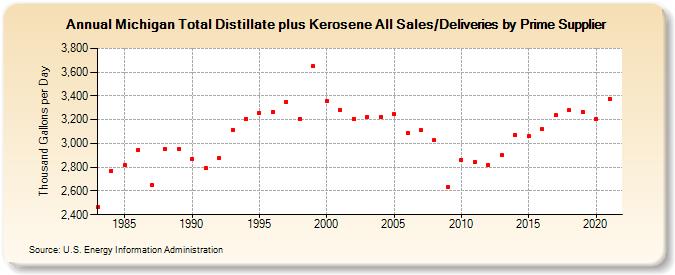
| Michigan Total Distillate plus Kerosene All Sales/Deliveries by Prime Supplier (Thousand Gallons per Day) | ||||||||
| Decade | Year-0 | Year-1 | Year-2 | Year-3 | Year-4 | Year-5 | Year-6 | Year-7 | Year-8 | Year-9 |
|---|---|---|---|---|---|---|---|---|---|---|
| 1980's | 2,464.1 | 2,770.5 | 2,815.7 | 2,948.5 | 2,649.1 | 2,954.9 | 2,954.2 | |||
| 1990's | 2,869.6 | 2,792.7 | 2,873.5 | 3,116.6 | 3,209.8 | 3,257.7 | 3,267.8 | 3,352.7 | 3,206.4 | 3,648.2 |
| 2000's | 3,353.5 | 3,285.3 | 3,209.8 | 3,224.8 | 3,222.9 | 3,244.9 | 3,089.4 | 3,109.0 | 3,025.1 | 2,634.4 |
| 2010's | 2,864.3 | 2,845.3 | 2,816.7 | 2,900.9 | 3,072.0 | 3,061.4 | 3,122.4 | 3,236.1 | 3,278.6 | 3,267.9 |
| 2020's | 3,207.6 |
| - = No Data Reported; -- = Not Applicable; NA = Not Available; W = Withheld to avoid disclosure of individual company data. |
| Release Date: 6/1/2022 |
| Next Release Date: TBD |