|
Download Data (XLS File) |
|
||||||||
|
||||||||
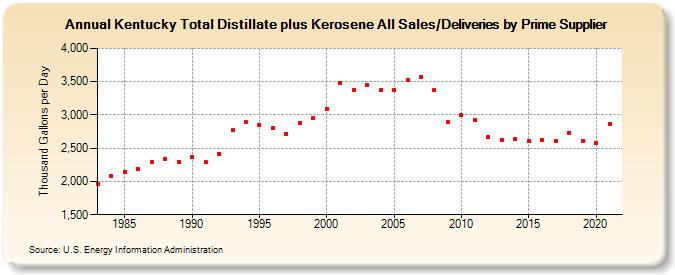
| Kentucky Total Distillate plus Kerosene All Sales/Deliveries by Prime Supplier (Thousand Gallons per Day) | ||||||||
| Decade | Year-0 | Year-1 | Year-2 | Year-3 | Year-4 | Year-5 | Year-6 | Year-7 | Year-8 | Year-9 |
|---|---|---|---|---|---|---|---|---|---|---|
| 1980's | 1,954.4 | 2,076.6 | 2,148.7 | 2,188.8 | 2,294.0 | 2,330.8 | 2,299.6 | |||
| 1990's | 2,372.7 | 2,287.2 | 2,419.4 | 2,772.6 | 2,888.4 | 2,851.1 | 2,805.2 | 2,717.2 | 2,875.8 | 2,951.0 |
| 2000's | 3,086.3 | 3,476.8 | 3,378.3 | 3,453.3 | 3,375.6 | 3,376.7 | 3,520.7 | 3,568.6 | 3,367.2 | 2,893.7 |
| 2010's | 2,998.4 | 2,919.7 | 2,668.3 | 2,616.2 | 2,639.3 | 2,611.8 | 2,617.5 | 2,603.7 | 2,731.4 | 2,613.3 |
| 2020's | 2,572.6 |
| - = No Data Reported; -- = Not Applicable; NA = Not Available; W = Withheld to avoid disclosure of individual company data. |
| Release Date: 6/1/2022 |
| Next Release Date: TBD |