|
Download Data (XLS File) |
|
||||||||
|
||||||||
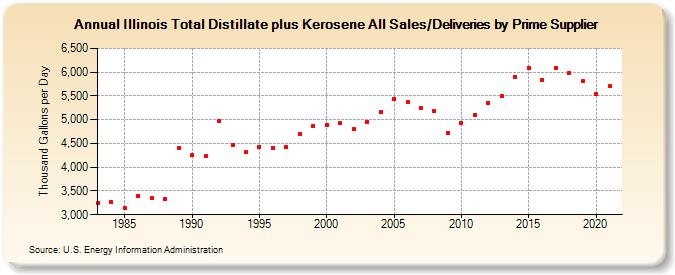
| Illinois Total Distillate plus Kerosene All Sales/Deliveries by Prime Supplier (Thousand Gallons per Day) | ||||||||
| Decade | Year-0 | Year-1 | Year-2 | Year-3 | Year-4 | Year-5 | Year-6 | Year-7 | Year-8 | Year-9 |
|---|---|---|---|---|---|---|---|---|---|---|
| 1980's | 3,236.9 | 3,262.9 | 3,139.8 | 3,392.4 | 3,348.9 | 3,326.3 | 4,402.5 | |||
| 1990's | 4,253.2 | 4,231.9 | 4,976.7 | 4,458.9 | 4,321.0 | 4,434.0 | 4,411.2 | 4,422.9 | 4,707.8 | 4,867.6 |
| 2000's | 4,884.7 | 4,931.8 | 4,807.1 | 4,960.7 | 5,153.0 | 5,434.0 | 5,368.1 | 5,238.4 | 5,186.0 | 4,711.4 |
| 2010's | 4,929.0 | 5,098.5 | 5,361.0 | 5,489.9 | 5,905.5 | 6,089.9 | 5,840.6 | 6,093.7 | 5,978.7 | 5,805.8 |
| 2020's | 5,535.5 |
| - = No Data Reported; -- = Not Applicable; NA = Not Available; W = Withheld to avoid disclosure of individual company data. |
| Release Date: 6/1/2022 |
| Next Release Date: TBD |