|
Download Data (XLS File) |
|
||||||||
|
||||||||
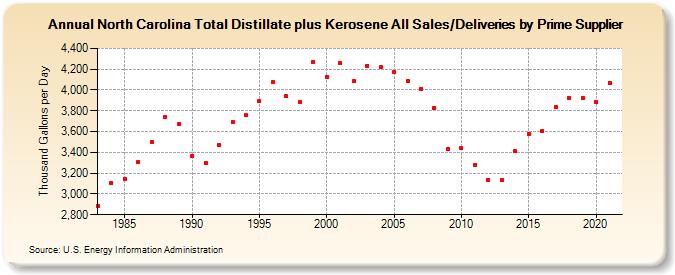
| North Carolina Total Distillate plus Kerosene All Sales/Deliveries by Prime Supplier (Thousand Gallons per Day) | ||||||||
| Decade | Year-0 | Year-1 | Year-2 | Year-3 | Year-4 | Year-5 | Year-6 | Year-7 | Year-8 | Year-9 |
|---|---|---|---|---|---|---|---|---|---|---|
| 1980's | 2,886.7 | 3,105.6 | 3,148.3 | 3,303.0 | 3,495.1 | 3,736.7 | 3,670.5 | |||
| 1990's | 3,367.6 | 3,301.9 | 3,474.4 | 3,694.2 | 3,755.6 | 3,892.1 | 4,074.6 | 3,938.4 | 3,880.1 | 4,266.8 |
| 2000's | 4,127.9 | 4,257.2 | 4,085.6 | 4,233.9 | 4,217.6 | 4,172.7 | 4,087.7 | 4,010.9 | 3,827.3 | 3,428.0 |
| 2010's | 3,437.8 | 3,282.9 | 3,136.0 | 3,129.5 | 3,409.4 | 3,576.5 | 3,606.4 | 3,838.3 | 3,927.2 | 3,923.3 |
| 2020's | 3,884.6 |
| - = No Data Reported; -- = Not Applicable; NA = Not Available; W = Withheld to avoid disclosure of individual company data. |
| Release Date: 6/1/2022 |
| Next Release Date: TBD |