|
Download Data (XLS File) |
|
||||||||
|
||||||||
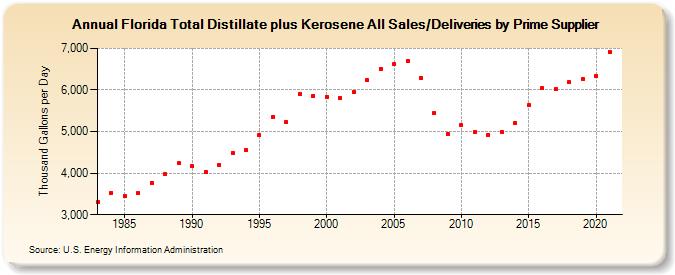
| Florida Total Distillate plus Kerosene All Sales/Deliveries by Prime Supplier (Thousand Gallons per Day) | ||||||||
| Decade | Year-0 | Year-1 | Year-2 | Year-3 | Year-4 | Year-5 | Year-6 | Year-7 | Year-8 | Year-9 |
|---|---|---|---|---|---|---|---|---|---|---|
| 1980's | 3,300.4 | 3,532.2 | 3,455.8 | 3,524.6 | 3,767.5 | 3,968.9 | 4,232.4 | |||
| 1990's | 4,167.6 | 4,023.5 | 4,196.2 | 4,485.3 | 4,555.6 | 4,915.4 | 5,355.6 | 5,227.9 | 5,906.2 | 5,857.3 |
| 2000's | 5,842.0 | 5,801.0 | 5,956.8 | 6,231.6 | 6,515.6 | 6,614.1 | 6,700.9 | 6,288.2 | 5,440.6 | 4,936.3 |
| 2010's | 5,145.7 | 4,988.0 | 4,925.3 | 4,983.6 | 5,215.7 | 5,631.2 | 6,042.6 | 6,022.6 | 6,181.5 | 6,260.3 |
| 2020's | 6,330.1 |
| - = No Data Reported; -- = Not Applicable; NA = Not Available; W = Withheld to avoid disclosure of individual company data. |
| Release Date: 6/1/2022 |
| Next Release Date: TBD |