|
Download Data (XLS File) |
|
||||||||
|
||||||||
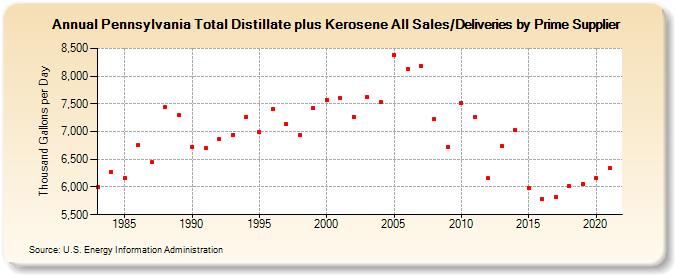
| Pennsylvania Total Distillate plus Kerosene All Sales/Deliveries by Prime Supplier (Thousand Gallons per Day) | ||||||||
| Decade | Year-0 | Year-1 | Year-2 | Year-3 | Year-4 | Year-5 | Year-6 | Year-7 | Year-8 | Year-9 |
|---|---|---|---|---|---|---|---|---|---|---|
| 1980's | 6,003.2 | 6,266.6 | 6,166.0 | 6,751.4 | 6,442.9 | 7,441.2 | 7,296.4 | |||
| 1990's | 6,729.6 | 6,698.4 | 6,864.0 | 6,946.3 | 7,260.8 | 6,987.4 | 7,405.8 | 7,140.2 | 6,929.7 | 7,417.9 |
| 2000's | 7,574.6 | 7,598.5 | 7,263.4 | 7,621.9 | 7,536.7 | 8,373.8 | 8,119.4 | 8,180.6 | 7,221.5 | 6,716.2 |
| 2010's | 7,517.8 | 7,256.3 | 6,156.0 | 6,746.8 | 7,031.6 | 5,980.0 | 5,790.7 | 5,820.1 | 6,011.7 | 6,048.5 |
| 2020's | 6,158.9 |
| - = No Data Reported; -- = Not Applicable; NA = Not Available; W = Withheld to avoid disclosure of individual company data. |
| Release Date: 6/1/2022 |
| Next Release Date: TBD |