|
Download Data (XLS File) |
|
||||||||
|
||||||||
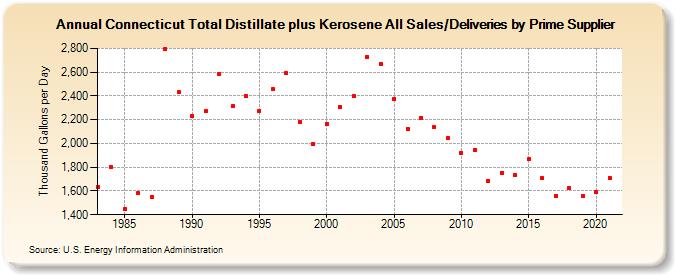
| Connecticut Total Distillate plus Kerosene All Sales/Deliveries by Prime Supplier (Thousand Gallons per Day) | ||||||||
| Decade | Year-0 | Year-1 | Year-2 | Year-3 | Year-4 | Year-5 | Year-6 | Year-7 | Year-8 | Year-9 |
|---|---|---|---|---|---|---|---|---|---|---|
| 1980's | 1,631.3 | 1,805.6 | 1,448.7 | 1,580.5 | 1,550.7 | 2,793.1 | 2,428.9 | |||
| 1990's | 2,232.0 | 2,273.2 | 2,588.3 | 2,313.8 | 2,402.6 | 2,274.5 | 2,455.9 | 2,589.8 | 2,182.4 | 1,995.9 |
| 2000's | 2,165.9 | 2,308.2 | 2,396.2 | 2,730.6 | 2,670.5 | 2,372.4 | 2,124.9 | 2,215.9 | 2,135.3 | 2,044.1 |
| 2010's | 1,923.1 | 1,948.9 | 1,686.1 | 1,755.0 | 1,735.1 | 1,867.6 | 1,710.6 | 1,559.5 | 1,623.8 | 1,558.4 |
| 2020's | 1,587.6 |
| - = No Data Reported; -- = Not Applicable; NA = Not Available; W = Withheld to avoid disclosure of individual company data. |
| Release Date: 6/1/2022 |
| Next Release Date: TBD |