|
Download Data (XLS File) |
|
||||||||
|
||||||||
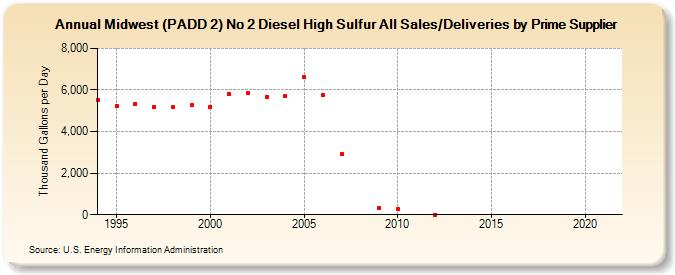
| Midwest (PADD 2) No 2 Diesel High Sulfur All Sales/Deliveries by Prime Supplier (Thousand Gallons per Day) | ||||||||
| Decade | Year-0 | Year-1 | Year-2 | Year-3 | Year-4 | Year-5 | Year-6 | Year-7 | Year-8 | Year-9 |
|---|---|---|---|---|---|---|---|---|---|---|
| 1990's | 5,497.9 | 5,251.4 | 5,348.5 | 5,196.5 | 5,172.6 | 5,269.0 | ||||
| 2000's | 5,204.3 | 5,799.9 | 5,847.5 | 5,672.1 | 5,718.7 | 6,610.6 | 5,774.9 | 2,938.5 | W | 313.9 |
| 2010's | 274.2 | - | 0.7 | - | W | W | W | W | W | W |
| 2020's | W |
| - = No Data Reported; -- = Not Applicable; NA = Not Available; W = Withheld to avoid disclosure of individual company data. |
| Release Date: 6/1/2022 |
| Next Release Date: TBD |