|
Download Data (XLS File) |
|
||||||||
|
||||||||
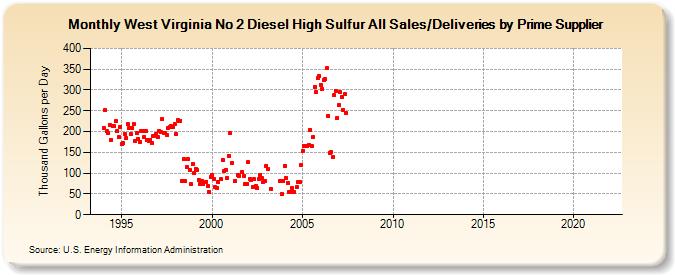
| West Virginia No 2 Diesel High Sulfur All Sales/Deliveries by Prime Supplier (Thousand Gallons per Day) | ||||||||
| Year | Jan | Feb | Mar | Apr | May | Jun | Jul | Aug | Sep | Oct | Nov | Dec |
|---|---|---|---|---|---|---|---|---|---|---|---|---|
| 1993 | NA | NA | NA | |||||||||
| 1994 | 208.8 | 250.8 | 201.4 | 196.9 | 216.4 | 179.7 | 213.6 | 212.4 | 224.7 | 200.9 | 185.8 | 212.0 |
| 1995 | 169.6 | 171.8 | 194.9 | 184.5 | 217.4 | 209.3 | 193.5 | 209.1 | 217.0 | 176.2 | 195.7 | 182.9 |
| 1996 | 175.7 | 201.0 | 200.2 | 186.3 | 201.9 | 179.8 | 178.0 | 180.5 | 171.3 | 190.1 | 188.2 | 193.9 |
| 1997 | 186.2 | 202.0 | 199.8 | 230.5 | 197.5 | 196.1 | 190.8 | 209.4 | 211.0 | 212.2 | 210.0 | 218.3 |
| 1998 | 193.4 | 227.5 | 225.8 | 226.2 | 80.7 | 133.4 | 80.1 | 114.4 | 133.0 | 106.9 | 73.1 | 121.4 |
| 1999 | 99.6 | 110.1 | 107.5 | 84.2 | 74.8 | 79.9 | 73.1 | W | 79.6 | 69.3 | 54.3 | 90.5 |
| 2000 | 95.5 | 86.8 | 65.9 | 64.8 | 79.2 | W | 85.2 | 132.2 | 104.2 | 108.1 | 87.9 | 140.9 |
| 2001 | 195.4 | 124.8 | W | 80.9 | W | 96.6 | 94.0 | W | 102.5 | 93.6 | 72.7 | 75.0 |
| 2002 | 126.7 | 85.3 | 84.4 | 67.6 | 85.1 | 70.1 | 64.4 | 85.7 | 96.3 | 87.3 | 79.7 | 80.3 |
| 2003 | 118.1 | 109.5 | W | 62.3 | W | W | W | W | W | 81.1 | 49.6 | 80.5 |
| 2004 | 117.4 | 88.4 | 77.0 | 54.0 | 55.7 | 63.5 | 55.7 | W | 66.1 | 79.2 | 77.6 | 119.4 |
| 2005 | 153.6 | 164.3 | 166.4 | 166.4 | 168.0 | 204.3 | 165.0 | 187.7 | 307.7 | 295.5 | 327.8 | 333.5 |
| 2006 | 313.1 | 301.2 | 323.9 | 326.1 | 351.8 | 238.6 | 149.4 | 151.4 | 138.8 | 287.3 | 298.6 | 232.4 |
| 2007 | 263.0 | 294.3 | 282.8 | 252.8 | 289.6 | 243.6 | W | W | W | W | W | W |
| 2008 | W | W | W | W | W | W | W | W | W | W | W | W |
| 2009 | W | W | W | - | - | W | W | - | W | - | W | W |
| 2010 | W | W | W | W | W | - | - | - | - | - | - | - |
| 2011 | - | - | - | - | - | - | - | - | - | - | - | - |
| 2012 | - | - | - | - | - | - | - | - | - | - | - | - |
| 2013 | - | - | - | - | - | - | - | - | - | - | - | - |
| 2014 | - | - | - | - | - | - | - | - | - | - | - | - |
| 2015 | - | - | - | - | - | - | - | - | - | - | - | - |
| 2016 | - | - | - | - | - | - | - | - | - | - | - | - |
| 2017 | - | - | - | - | - | - | - | - | - | - | - | - |
| 2018 | - | - | - | - | - | - | - | - | - | - | - | - |
| 2019 | - | - | - | - | - | - | - | - | - | - | - | - |
| 2020 | - | - | - | - | - | - | - | - | - | - | - | - |
| 2021 | - | - | - | - | - | - | - | - | - | - | - | - |
| 2022 | - | - | - | |||||||||
| - = No Data Reported; -- = Not Applicable; NA = Not Available; W = Withheld to avoid disclosure of individual company data. |
| Release Date: 5/19/2022 |
| Next Release Date: TBD |