|
Download Data (XLS File) |
|
||||||||
|
||||||||
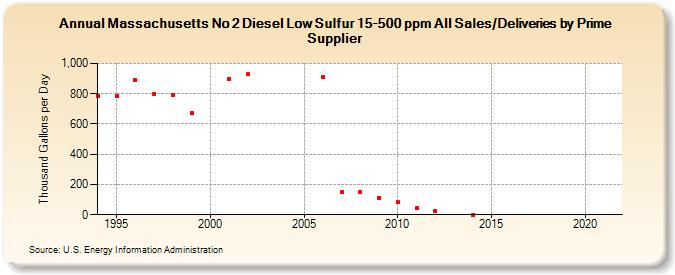
| Massachusetts No 2 Diesel Low Sulfur 15-500 ppm All Sales/Deliveries by Prime Supplier (Thousand Gallons per Day) | ||||||||
| Decade | Year-0 | Year-1 | Year-2 | Year-3 | Year-4 | Year-5 | Year-6 | Year-7 | Year-8 | Year-9 |
|---|---|---|---|---|---|---|---|---|---|---|
| 1990's | 787.6 | 785.4 | 892.1 | 799.1 | 794.2 | 674.7 | ||||
| 2000's | W | 897.7 | 930.0 | W | W | W | 909.8 | 149.9 | 151.6 | 113.1 |
| 2010's | 81.8 | 42.6 | 23.0 | W | 0.2 | - | - | - | - | - |
| 2020's | - |
| - = No Data Reported; -- = Not Applicable; NA = Not Available; W = Withheld to avoid disclosure of individual company data. |
| Release Date: 6/1/2022 |
| Next Release Date: TBD |