|
Download Data (XLS File) |
|
||||||||
|
||||||||
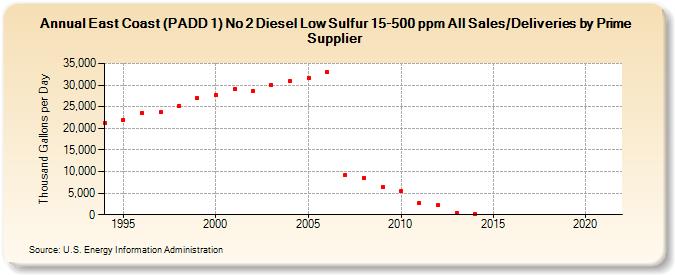
| East Coast (PADD 1) No 2 Diesel Low Sulfur 15-500 ppm All Sales/Deliveries by Prime Supplier (Thousand Gallons per Day) | ||||||||
| Decade | Year-0 | Year-1 | Year-2 | Year-3 | Year-4 | Year-5 | Year-6 | Year-7 | Year-8 | Year-9 |
|---|---|---|---|---|---|---|---|---|---|---|
| 1990's | 21,191.2 | 22,004.4 | 23,578.6 | 23,658.0 | 25,228.7 | 26,926.0 | ||||
| 2000's | 27,604.0 | 29,029.4 | 28,699.0 | 29,994.7 | 30,833.1 | 31,736.3 | 33,112.0 | 9,173.2 | 8,579.8 | 6,365.2 |
| 2010's | 5,405.1 | 2,729.7 | 2,161.2 | 374.4 | 158.2 | W | W | W | - | - |
| 2020's | - |
| - = No Data Reported; -- = Not Applicable; NA = Not Available; W = Withheld to avoid disclosure of individual company data. |
| Release Date: 6/1/2022 |
| Next Release Date: TBD |