|
Download Data (XLS File) |
|
||||||||
|
||||||||
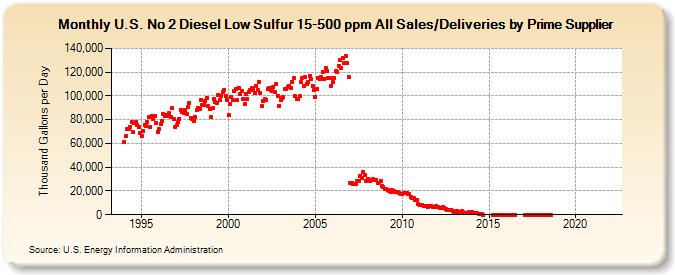
| U.S. No 2 Diesel Low Sulfur 15-500 ppm All Sales/Deliveries by Prime Supplier (Thousand Gallons per Day) | ||||||||
| Year | Jan | Feb | Mar | Apr | May | Jun | Jul | Aug | Sep | Oct | Nov | Dec |
|---|---|---|---|---|---|---|---|---|---|---|---|---|
| 1993 | NA | NA | NA | |||||||||
| 1994 | 61,034.2 | 66,337.4 | 72,423.2 | 72,486.3 | 74,112.4 | 77,880.6 | 69,656.5 | 77,285.8 | 77,732.1 | 75,571.2 | 73,543.8 | 69,071.7 |
| 1995 | 66,478.3 | 70,630.5 | 75,807.0 | 74,311.1 | 77,908.4 | 82,240.1 | 73,991.0 | 82,853.7 | 80,204.1 | 83,506.5 | 77,607.8 | 69,967.9 |
| 1996 | 72,118.7 | 76,234.8 | 78,746.7 | 85,180.7 | 83,213.2 | 83,513.2 | 82,742.6 | 85,266.5 | 82,490.9 | 89,431.9 | 80,476.9 | 74,097.8 |
| 1997 | 75,799.8 | 77,949.8 | 80,832.6 | 88,032.6 | 86,447.2 | 85,531.2 | 87,740.4 | 85,010.8 | 90,853.0 | 93,971.5 | 81,169.8 | 80,539.7 |
| 1998 | 78,544.5 | 81,957.0 | 87,940.5 | 90,081.2 | 88,582.4 | 96,532.1 | 92,096.8 | 92,556.5 | 95,400.1 | 98,616.5 | 91,110.1 | 88,601.0 |
| 1999 | 82,264.3 | 89,484.3 | 97,608.7 | 95,283.2 | 94,224.3 | 100,793.7 | 96,315.7 | 100,018.2 | 103,392.1 | 105,378.5 | 99,841.0 | 96,975.5 |
| 2000 | 83,645.7 | 92,793.9 | 99,107.4 | 96,451.7 | 104,210.1 | 106,023.6 | 96,465.7 | 107,001.6 | 101,586.0 | 103,997.8 | 97,047.3 | 93,172.3 |
| 2001 | 101,811.7 | 97,445.3 | 103,560.8 | 104,764.1 | 106,603.1 | 104,895.0 | 102,366.0 | 108,730.6 | 105,219.3 | 111,862.4 | 102,693.3 | 91,699.1 |
| 2002 | 95,621.3 | 97,187.5 | 96,870.2 | 105,722.9 | 106,800.2 | 104,720.6 | 104,180.6 | 107,251.9 | 103,134.6 | 110,188.6 | 100,092.7 | 91,750.8 |
| 2003 | 96,643.5 | 98,301.7 | 98,689.8 | 105,666.2 | 105,769.8 | 107,096.2 | 108,225.0 | 106,663.3 | 111,969.4 | 114,772.0 | 99,608.6 | 97,299.9 |
| 2004 | 97,584.2 | 99,882.2 | 111,465.8 | 115,478.9 | 108,732.3 | 115,897.3 | 110,436.4 | 112,066.7 | 117,153.0 | 114,226.7 | 108,675.2 | 105,371.6 |
| 2005 | 99,397.3 | 105,864.9 | 115,025.2 | 113,948.7 | 116,002.2 | 120,082.4 | 114,282.0 | 123,532.4 | 120,568.6 | 115,426.9 | 114,880.3 | 108,632.2 |
| 2006 | 111,450.2 | 115,344.0 | 120,939.9 | 120,277.3 | 125,446.7 | 129,909.0 | 123,465.4 | 132,315.9 | 127,622.0 | 133,664.6 | 127,700.1 | 116,091.9 |
| 2007 | 26,913.6 | 26,947.3 | 26,247.9 | 25,571.4 | 25,959.5 | 28,040.5 | 28,130.1 | 32,666.6 | 31,266.8 | 36,144.5 | 33,148.7 | 28,399.1 |
| 2008 | 30,186.2 | 29,072.3 | 28,581.1 | 29,603.0 | 29,651.6 | 29,293.4 | 28,904.5 | 26,859.4 | 26,372.6 | 28,184.5 | 24,568.0 | 23,424.9 |
| 2009 | 21,755.5 | 21,319.9 | 20,815.2 | 20,140.2 | 19,256.2 | 20,603.9 | 19,606.5 | 19,333.1 | 19,394.4 | 18,710.0 | 18,145.1 | 17,381.1 |
| 2010 | 17,644.8 | 18,188.9 | 18,688.6 | 17,874.5 | 17,660.3 | 17,423.9 | 14,735.4 | 14,418.9 | 14,274.4 | 12,494.6 | 12,240.5 | 8,758.8 |
| 2011 | 8,141.6 | 7,961.3 | 8,199.0 | 7,509.2 | 7,393.0 | 7,458.0 | 6,707.6 | 7,405.1 | 7,485.7 | 6,896.3 | 6,878.5 | 7,046.0 |
| 2012 | 6,373.8 | 6,599.2 | 5,927.8 | 6,048.6 | 6,110.2 | 5,739.2 | 4,927.5 | 4,197.4 | 3,577.7 | 4,009.7 | 4,286.9 | 3,305.8 |
| 2013 | 2,219.3 | 2,665.8 | 2,726.3 | 2,585.2 | 2,700.7 | 2,726.6 | 2,218.7 | 1,731.8 | 1,552.8 | 1,692.5 | 2,258.2 | 2,152.8 |
| 2014 | 2,069.9 | 1,677.9 | 1,602.0 | 1,691.8 | 1,242.6 | 659.8 | 607.9 | 465.5 | 68.8 | W | W | W |
| 2015 | W | W | W | 152.1 | 124.9 | 85.1 | 34.1 | 38.3 | 56.4 | 75.0 | 67.8 | 68.9 |
| 2016 | W | 39.2 | W | W | 57.0 | 66.5 | 80.0 | W | W | W | W | W |
| 2017 | W | 54.0 | W | 134.1 | 107.1 | 85.6 | 85.9 | 78.7 | 77.9 | 87.8 | 109.5 | 83.7 |
| 2018 | 121.7 | 147.0 | 167.8 | 119.1 | 131.8 | 130.7 | 107.3 | 119.1 | W | W | W | W |
| 2019 | W | W | W | W | W | W | W | W | W | W | W | W |
| 2020 | W | W | W | W | W | W | W | W | W | W | W | W |
| 2021 | W | W | W | W | W | W | W | W | W | W | W | W |
| 2022 | W | W | W | |||||||||
| - = No Data Reported; -- = Not Applicable; NA = Not Available; W = Withheld to avoid disclosure of individual company data. |
| Release Date: 5/19/2022 |
| Next Release Date: TBD |