|
Download Data (XLS File) |
|
||||||||
|
||||||||
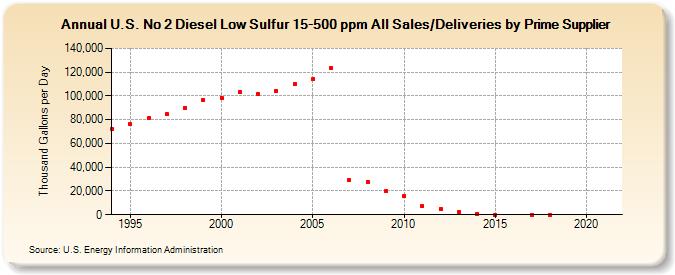
| U.S. No 2 Diesel Low Sulfur 15-500 ppm All Sales/Deliveries by Prime Supplier (Thousand Gallons per Day) | ||||||||
| Decade | Year-0 | Year-1 | Year-2 | Year-3 | Year-4 | Year-5 | Year-6 | Year-7 | Year-8 | Year-9 |
|---|---|---|---|---|---|---|---|---|---|---|
| 1990's | 72,275.4 | 76,313.5 | 81,133.3 | 84,522.7 | 90,201.6 | 96,825.2 | ||||
| 2000's | 98,469.7 | 103,510.3 | 101,983.4 | 104,253.8 | 109,751.7 | 113,999.6 | 123,724.7 | 29,133.3 | 27,890.1 | 19,693.3 |
| 2010's | 15,342.8 | 7,420.0 | 5,085.7 | 2,265.8 | 845.4 | 77.6 | W | 85.7 | 110.0 | W |
| 2020's | W |
| - = No Data Reported; -- = Not Applicable; NA = Not Available; W = Withheld to avoid disclosure of individual company data. |
| Release Date: 6/1/2022 |
| Next Release Date: TBD |