|
Download Data (XLS File) |
|
||||||||
|
||||||||
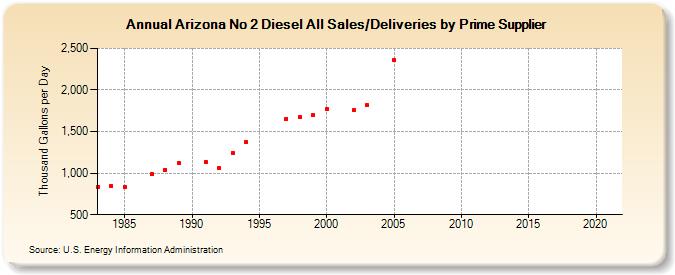
| Arizona No 2 Diesel All Sales/Deliveries by Prime Supplier (Thousand Gallons per Day) | ||||||||
| Decade | Year-0 | Year-1 | Year-2 | Year-3 | Year-4 | Year-5 | Year-6 | Year-7 | Year-8 | Year-9 |
|---|---|---|---|---|---|---|---|---|---|---|
| 1980's | 837.7 | 845.5 | 830.7 | W | 987.7 | 1,041.8 | 1,125.6 | |||
| 1990's | W | 1,137.6 | 1,057.7 | 1,245.7 | 1,374.3 | W | W | 1,655.9 | 1,674.5 | 1,697.3 |
| 2000's | 1,766.9 | W | 1,759.1 | 1,814.1 | W | 2,362.6 | W | NA | NA | NA |
| 2010's | NA | NA | NA | NA | NA | NA | NA | NA | NA | NA |
| 2020's | NA |
| - = No Data Reported; -- = Not Applicable; NA = Not Available; W = Withheld to avoid disclosure of individual company data. |
| Release Date: 6/1/2022 |
| Next Release Date: TBD |