|
Download Data (XLS File) |
|
||||||||
|
||||||||
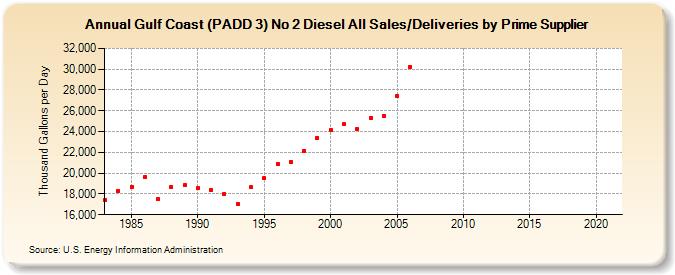
| Gulf Coast (PADD 3) No 2 Diesel All Sales/Deliveries by Prime Supplier (Thousand Gallons per Day) | ||||||||
| Decade | Year-0 | Year-1 | Year-2 | Year-3 | Year-4 | Year-5 | Year-6 | Year-7 | Year-8 | Year-9 |
|---|---|---|---|---|---|---|---|---|---|---|
| 1980's | 17,416.8 | 18,326.2 | 18,699.6 | 19,608.2 | 17,531.7 | 18,700.1 | 18,844.8 | |||
| 1990's | 18,587.6 | 18,344.7 | 17,969.8 | 17,042.0 | 18,633.2 | 19,514.1 | 20,895.6 | 21,078.8 | 22,154.6 | 23,383.0 |
| 2000's | 24,142.2 | 24,680.4 | 24,215.0 | 25,346.6 | 25,518.2 | 27,458.9 | 30,224.6 | NA | NA | NA |
| 2010's | NA | NA | NA | NA | NA | NA | NA | NA | NA | NA |
| 2020's | NA |
| - = No Data Reported; -- = Not Applicable; NA = Not Available; W = Withheld to avoid disclosure of individual company data. |
| Release Date: 6/1/2022 |
| Next Release Date: TBD |