|
Download Data (XLS File) |
|
||||||||
|
||||||||
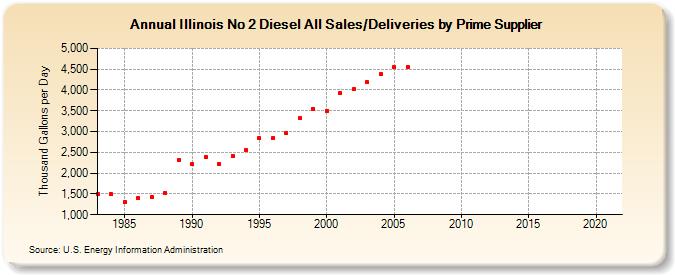
| Illinois No 2 Diesel All Sales/Deliveries by Prime Supplier (Thousand Gallons per Day) | ||||||||
| Decade | Year-0 | Year-1 | Year-2 | Year-3 | Year-4 | Year-5 | Year-6 | Year-7 | Year-8 | Year-9 |
|---|---|---|---|---|---|---|---|---|---|---|
| 1980's | 1,508.0 | 1,492.0 | 1,306.0 | 1,402.3 | 1,436.0 | 1,528.0 | 2,318.7 | |||
| 1990's | 2,208.9 | 2,391.0 | 2,218.9 | 2,422.8 | 2,544.7 | 2,843.6 | 2,842.1 | 2,956.6 | 3,318.0 | 3,541.1 |
| 2000's | 3,496.2 | 3,926.8 | 4,012.8 | 4,179.9 | 4,374.0 | 4,547.4 | 4,559.9 | NA | NA | NA |
| 2010's | NA | NA | NA | NA | NA | NA | NA | NA | NA | NA |
| 2020's | NA |
| - = No Data Reported; -- = Not Applicable; NA = Not Available; W = Withheld to avoid disclosure of individual company data. |
| Release Date: 6/1/2022 |
| Next Release Date: TBD |