|
Download Data (XLS File) |
|
||||||||
|
||||||||
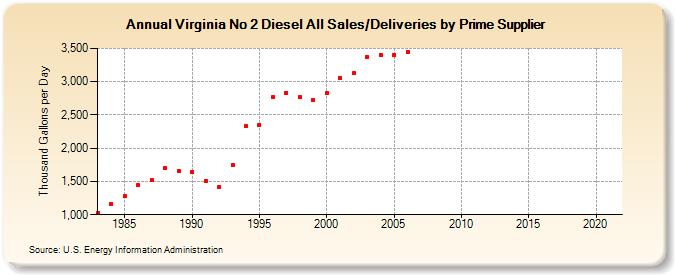
| Virginia No 2 Diesel All Sales/Deliveries by Prime Supplier (Thousand Gallons per Day) | ||||||||
| Decade | Year-0 | Year-1 | Year-2 | Year-3 | Year-4 | Year-5 | Year-6 | Year-7 | Year-8 | Year-9 |
|---|---|---|---|---|---|---|---|---|---|---|
| 1980's | 1,032.8 | 1,162.6 | 1,275.6 | 1,442.6 | 1,528.4 | 1,699.4 | 1,660.2 | |||
| 1990's | 1,639.5 | 1,506.3 | 1,421.3 | 1,744.3 | 2,328.4 | 2,355.8 | 2,766.1 | 2,835.8 | 2,766.0 | 2,721.4 |
| 2000's | 2,823.1 | 3,058.5 | 3,124.7 | 3,370.9 | 3,407.8 | 3,405.7 | 3,452.4 | NA | NA | NA |
| 2010's | NA | NA | NA | NA | NA | NA | NA | NA | NA | NA |
| 2020's | NA |
| - = No Data Reported; -- = Not Applicable; NA = Not Available; W = Withheld to avoid disclosure of individual company data. |
| Release Date: 6/1/2022 |
| Next Release Date: TBD |