|
Download Data (XLS File) |
|
||||||||
|
||||||||
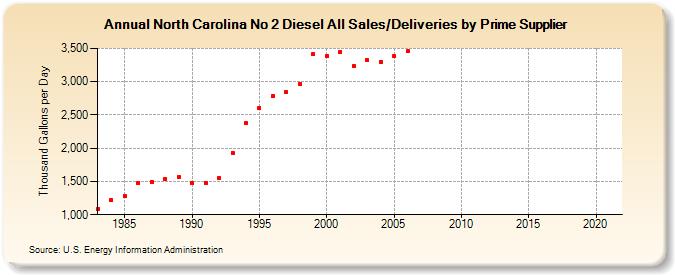
| North Carolina No 2 Diesel All Sales/Deliveries by Prime Supplier (Thousand Gallons per Day) | ||||||||
| Decade | Year-0 | Year-1 | Year-2 | Year-3 | Year-4 | Year-5 | Year-6 | Year-7 | Year-8 | Year-9 |
|---|---|---|---|---|---|---|---|---|---|---|
| 1980's | 1,093.1 | 1,221.6 | 1,284.8 | 1,477.7 | 1,495.4 | 1,536.7 | 1,564.5 | |||
| 1990's | 1,469.5 | 1,479.4 | 1,549.7 | 1,934.5 | 2,374.8 | 2,606.7 | 2,785.8 | 2,839.6 | 2,966.9 | 3,412.9 |
| 2000's | 3,388.4 | 3,446.6 | 3,238.0 | 3,321.1 | 3,293.3 | 3,379.8 | 3,453.5 | NA | NA | NA |
| 2010's | NA | NA | NA | NA | NA | NA | NA | NA | NA | NA |
| 2020's | NA |
| - = No Data Reported; -- = Not Applicable; NA = Not Available; W = Withheld to avoid disclosure of individual company data. |
| Release Date: 6/1/2022 |
| Next Release Date: TBD |