|
Download Data (XLS File) |
|
||||||||
|
||||||||
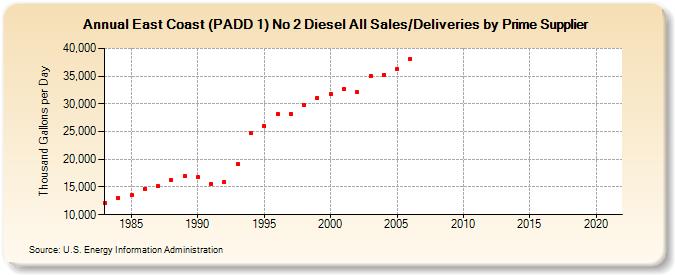
| East Coast (PADD 1) No 2 Diesel All Sales/Deliveries by Prime Supplier (Thousand Gallons per Day) | ||||||||
| Decade | Year-0 | Year-1 | Year-2 | Year-3 | Year-4 | Year-5 | Year-6 | Year-7 | Year-8 | Year-9 |
|---|---|---|---|---|---|---|---|---|---|---|
| 1980's | 12,110.5 | 13,068.0 | 13,501.7 | 14,684.3 | 15,168.1 | 16,314.3 | 17,017.6 | |||
| 1990's | 16,756.2 | 15,553.6 | 15,922.6 | 19,142.8 | 24,691.1 | 25,978.5 | 28,155.9 | 28,208.7 | 29,826.3 | 31,066.1 |
| 2000's | 31,859.5 | 32,706.9 | 32,052.0 | 35,102.7 | 35,285.1 | 36,193.9 | 38,173.9 | NA | NA | NA |
| 2010's | NA | NA | NA | NA | NA | NA | NA | NA | NA | NA |
| 2020's | NA |
| - = No Data Reported; -- = Not Applicable; NA = Not Available; W = Withheld to avoid disclosure of individual company data. |
| Release Date: 6/1/2022 |
| Next Release Date: TBD |