|
Download Data (XLS File) |
|
||||||||
|
||||||||
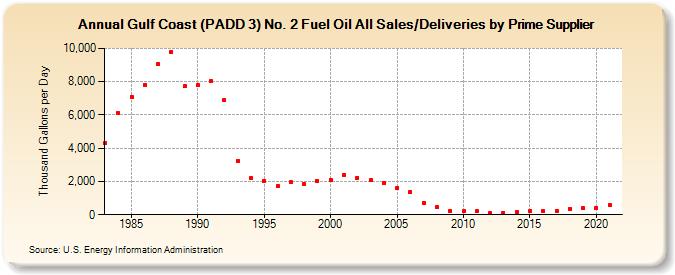
| Gulf Coast (PADD 3) No. 2 Fuel Oil All Sales/Deliveries by Prime Supplier (Thousand Gallons per Day) | ||||||||
| Decade | Year-0 | Year-1 | Year-2 | Year-3 | Year-4 | Year-5 | Year-6 | Year-7 | Year-8 | Year-9 |
|---|---|---|---|---|---|---|---|---|---|---|
| 1980's | 4,314.6 | 6,121.3 | 7,095.1 | 7,799.9 | 9,067.8 | 9,804.2 | 7,712.4 | |||
| 1990's | 7,783.6 | 8,020.4 | 6,880.3 | 3,259.2 | 2,181.3 | 2,053.4 | 1,728.0 | 1,939.8 | 1,819.3 | 2,035.9 |
| 2000's | 2,102.5 | 2,391.2 | 2,225.0 | 2,084.4 | 1,886.4 | 1,607.1 | 1,366.7 | 704.9 | 435.6 | 216.4 |
| 2010's | 198.9 | 194.8 | 79.8 | 105.4 | 191.1 | 218.9 | 212.7 | 242.6 | 370.1 | 395.0 |
| 2020's | 426.7 |
| - = No Data Reported; -- = Not Applicable; NA = Not Available; W = Withheld to avoid disclosure of individual company data. |
| Release Date: 6/1/2022 |
| Next Release Date: TBD |