|
Download Data (XLS File) |
|
||||||||
|
||||||||
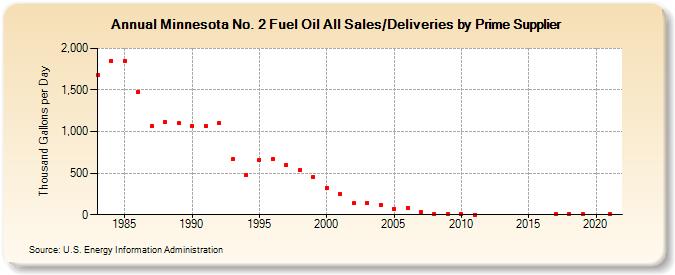
| Minnesota No. 2 Fuel Oil All Sales/Deliveries by Prime Supplier (Thousand Gallons per Day) | ||||||||
| Decade | Year-0 | Year-1 | Year-2 | Year-3 | Year-4 | Year-5 | Year-6 | Year-7 | Year-8 | Year-9 |
|---|---|---|---|---|---|---|---|---|---|---|
| 1980's | 1,676.0 | 1,850.9 | 1,852.6 | 1,478.2 | 1,064.3 | 1,116.3 | 1,101.2 | |||
| 1990's | 1,072.1 | 1,067.2 | 1,105.4 | 664.1 | 477.3 | 661.4 | 670.1 | 595.5 | 533.8 | 452.3 |
| 2000's | 326.1 | 251.8 | 140.7 | 143.8 | 121.9 | 74.1 | 86.7 | 38.2 | 7.3 | 4.7 |
| 2010's | 7.9 | 1.1 | W | W | W | W | W | 3.5 | 13.2 | 4.6 |
| 2020's | W |
| - = No Data Reported; -- = Not Applicable; NA = Not Available; W = Withheld to avoid disclosure of individual company data. |
| Release Date: 6/1/2022 |
| Next Release Date: TBD |