|
Download Data (XLS File) |
|
||||||||
|
||||||||
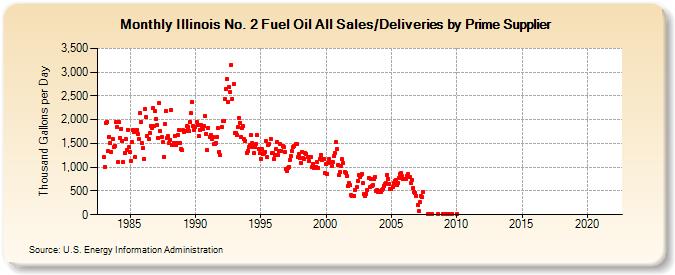
| Illinois No. 2 Fuel Oil All Sales/Deliveries by Prime Supplier (Thousand Gallons per Day) | ||||||||
| Year | Jan | Feb | Mar | Apr | May | Jun | Jul | Aug | Sep | Oct | Nov | Dec |
|---|---|---|---|---|---|---|---|---|---|---|---|---|
| 1983 | 1,210.3 | 1,014.1 | 1,935.8 | 1,953.9 | 1,336.0 | 1,642.4 | 1,500.5 | 1,325.8 | 1,588.0 | 1,421.1 | 1,453.3 | 1,945.2 |
| 1984 | 1,842.9 | 1,106.7 | 1,947.9 | 1,614.7 | 1,813.1 | 1,557.0 | 1,106.7 | 1,300.8 | 1,591.4 | 1,362.3 | 1,790.2 | 1,415.3 |
| 1985 | 1,316.8 | 1,137.2 | 1,527.5 | 1,787.7 | 1,730.6 | 1,206.0 | 1,787.6 | 1,704.1 | 1,601.8 | 2,137.0 | 1,947.8 | 1,504.0 |
| 1986 | 1,402.3 | 1,181.0 | 2,227.2 | 2,058.6 | 1,661.1 | 1,599.5 | 1,718.3 | 1,867.1 | 1,815.6 | 2,235.3 | 1,873.5 | 2,173.9 |
| 1987 | 2,020.5 | 1,885.7 | 1,622.8 | 2,354.5 | 1,757.9 | 1,624.9 | 1,525.5 | 1,222.8 | 1,918.0 | 2,180.4 | 1,605.1 | 1,655.9 |
| 1988 | 1,514.2 | 1,578.1 | 2,211.1 | 1,464.7 | 1,509.4 | 1,659.4 | 1,467.6 | 1,508.5 | 1,685.4 | 1,788.5 | 1,508.1 | 1,391.6 |
| 1989 | 1,352.2 | 1,772.2 | 1,746.3 | 1,765.5 | 1,859.3 | 1,846.1 | 1,753.6 | 1,946.4 | 2,130.4 | 2,366.8 | 1,862.5 | 1,788.6 |
| 1990 | 1,850.9 | 1,951.5 | 1,893.5 | 1,646.2 | 1,784.2 | 1,885.1 | 1,867.9 | 1,813.1 | 1,869.1 | 2,073.3 | 1,698.6 | 1,357.2 |
| 1991 | 1,829.8 | 1,630.4 | 1,679.0 | 1,586.7 | 1,639.7 | 1,486.3 | 1,490.6 | 1,514.4 | 1,643.3 | 1,818.0 | 1,325.4 | 1,246.5 |
| 1992 | 1,851.3 | 1,967.2 | 1,977.9 | 2,426.6 | 2,642.5 | 2,846.0 | 2,381.5 | 2,678.5 | 2,584.3 | 3,153.9 | 2,437.9 | 2,741.1 |
| 1993 | 1,726.2 | 1,729.9 | 1,677.8 | 1,844.8 | 2,038.7 | 1,938.0 | 1,645.0 | 1,835.2 | 1,858.1 | 1,583.9 | 1,556.9 | 1,301.9 |
| 1994 | 1,348.8 | 1,416.9 | 1,470.1 | 1,672.2 | 1,500.8 | 1,425.7 | 1,288.4 | 1,420.7 | 1,497.8 | 1,670.5 | 1,391.4 | 1,295.5 |
| 1995 | 1,176.5 | 1,378.6 | 1,270.2 | 1,308.9 | 1,316.5 | 1,544.0 | 1,211.5 | 1,469.2 | 1,493.5 | 1,602.2 | 1,294.5 | 1,292.4 |
| 1996 | 1,162.2 | 1,256.1 | 1,373.5 | 1,526.4 | 1,259.5 | 1,348.4 | 1,486.8 | 1,346.6 | 1,455.0 | 1,428.7 | 1,323.1 | 962.2 |
| 1997 | 928.4 | 979.5 | 1,011.1 | 1,158.5 | 1,233.8 | 1,332.2 | 1,421.2 | 1,450.9 | 1,481.5 | 1,489.6 | 1,205.3 | 1,280.1 |
| 1998 | 1,193.2 | 1,093.5 | 1,328.7 | 1,197.0 | 1,179.4 | 1,306.9 | 1,278.7 | 1,211.0 | 1,133.1 | 1,224.9 | 1,205.3 | 998.9 |
| 1999 | 1,074.3 | 988.4 | 1,005.5 | 1,011.3 | 1,117.4 | 989.7 | 1,172.6 | 1,261.8 | 1,147.6 | 1,176.8 | 1,180.3 | 884.5 |
| 2000 | 1,066.3 | 862.8 | 1,089.1 | 1,171.1 | 1,107.0 | 1,022.8 | 1,110.4 | 1,225.7 | 1,299.1 | 1,524.7 | 1,376.0 | 1,055.5 |
| 2001 | 832.9 | 890.3 | 1,031.9 | 1,166.6 | 1,081.1 | 903.7 | 886.1 | 804.7 | 604.7 | 667.0 | 617.6 | 414.7 |
| 2002 | 401.8 | 390.5 | 400.3 | 526.6 | 586.0 | 710.8 | 830.6 | 803.8 | 830.1 | 863.3 | 659.5 | 441.6 |
| 2003 | 396.8 | 442.7 | 515.0 | 773.5 | 573.6 | 759.7 | 613.3 | 619.1 | 745.5 | 803.6 | 505.0 | 530.3 |
| 2004 | 473.5 | 498.6 | 475.8 | 527.1 | 546.1 | 608.6 | 644.7 | 663.8 | 844.7 | 756.8 | 641.7 | 531.9 |
| 2005 | 542.8 | 581.6 | 663.5 | 716.3 | 724.2 | 617.2 | 672.9 | 773.9 | 851.0 | 875.4 | 806.6 | 752.5 |
| 2006 | 755.9 | 761.1 | 814.0 | 851.6 | 798.4 | 785.3 | 659.9 | 728.9 | 565.7 | 487.8 | 460.2 | 394.0 |
| 2007 | 204.8 | 69.7 | 258.2 | 394.2 | 370.1 | 482.6 | NA | NA | NA | W | 10.1 | 7.0 |
| 2008 | W | 14.3 | W | W | W | W | W | 17.3 | W | W | W | 11.3 |
| 2009 | W | 11.1 | 12.1 | W | W | 19.9 | 18.6 | 19.9 | 18.4 | W | W | W |
| 2010 | 12.5 | W | W | W | W | W | W | W | W | W | W | - |
| 2011 | W | - | - | - | - | - | - | - | - | - | - | - |
| 2012 | - | - | - | - | - | - | - | - | - | - | - | - |
| 2013 | - | - | - | - | - | - | - | - | - | - | - | - |
| 2014 | - | - | - | - | - | - | - | - | - | - | - | - |
| 2015 | - | - | - | - | - | - | - | - | - | - | - | - |
| 2016 | - | - | - | - | - | - | - | - | - | - | - | - |
| 2017 | - | - | - | - | - | - | - | - | - | - | - | - |
| 2018 | - | - | - | - | - | - | - | - | - | - | - | - |
| 2019 | - | - | - | - | - | - | - | - | - | - | - | - |
| 2020 | - | - | - | - | - | - | - | - | - | - | - | - |
| 2021 | - | - | - | - | - | - | - | - | - | - | - | - |
| 2022 | - | - | - | |||||||||
| - = No Data Reported; -- = Not Applicable; NA = Not Available; W = Withheld to avoid disclosure of individual company data. |
| Release Date: 5/19/2022 |
| Next Release Date: TBD |