|
Download Data (XLS File) |
|
||||||||
|
||||||||
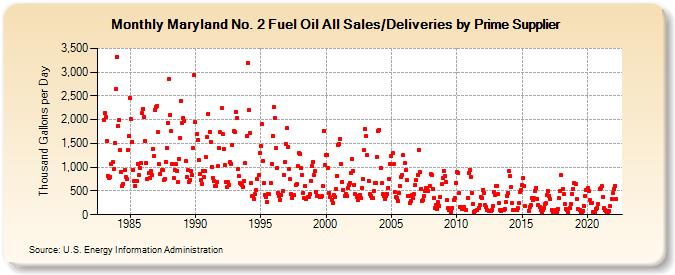
| Maryland No. 2 Fuel Oil All Sales/Deliveries by Prime Supplier (Thousand Gallons per Day) | ||||||||
| Year | Jan | Feb | Mar | Apr | May | Jun | Jul | Aug | Sep | Oct | Nov | Dec |
|---|---|---|---|---|---|---|---|---|---|---|---|---|
| 1983 | 1,984.2 | 2,147.1 | 2,050.4 | 1,542.4 | 821.2 | 763.5 | 787.6 | 1,069.3 | 1,104.2 | 953.4 | 1,506.2 | 2,655.5 |
| 1984 | 3,319.5 | 1,869.4 | 1,987.3 | 1,355.5 | 902.0 | 605.7 | 640.0 | 935.1 | 790.4 | 741.5 | 1,353.8 | 1,648.5 |
| 1985 | 2,459.7 | 2,004.2 | 1,535.6 | 950.7 | 713.6 | 613.2 | 699.8 | 1,068.2 | 834.9 | 989.7 | 1,086.0 | 2,132.7 |
| 1986 | 2,233.7 | 2,066.1 | 1,545.9 | 1,083.2 | 748.1 | 867.5 | 762.4 | 926.6 | 830.3 | 1,390.9 | 1,238.7 | 2,199.9 |
| 1987 | 2,261.8 | 2,291.9 | 1,733.2 | 1,066.6 | 853.8 | 935.1 | 947.5 | 725.6 | 756.2 | 1,119.5 | 1,397.2 | 1,928.1 |
| 1988 | 2,851.8 | 2,104.7 | 1,755.9 | 1,071.0 | 768.3 | 930.8 | 1,075.8 | 919.1 | 683.2 | 1,182.9 | 1,606.4 | 2,401.4 |
| 1989 | 1,922.5 | 2,041.6 | 1,981.5 | 1,123.8 | 802.2 | 936.7 | 695.7 | 736.3 | 926.3 | 829.1 | 1,402.4 | 2,934.0 |
| 1990 | 1,942.7 | 1,692.0 | 1,568.4 | 1,153.7 | 849.2 | 724.3 | 650.1 | 922.5 | 788.1 | 918.6 | 1,207.3 | 1,641.0 |
| 1991 | 2,126.3 | 1,748.5 | 1,534.5 | 1,009.0 | 781.3 | 708.4 | 602.4 | 601.9 | 692.6 | 1,023.4 | 1,409.5 | 1,731.1 |
| 1992 | 2,235.2 | 1,692.4 | 1,379.0 | 1,040.5 | 693.9 | 573.2 | 680.0 | 634.8 | 1,102.8 | 1,073.6 | 1,473.7 | 1,751.3 |
| 1993 | 1,738.1 | 2,167.8 | 2,035.3 | 954.9 | 809.4 | 657.0 | 646.5 | 626.4 | 580.8 | 708.4 | 1,092.8 | 1,652.4 |
| 1994 | 3,195.9 | 2,202.0 | 1,718.1 | 670.2 | 392.5 | 401.5 | 327.9 | 429.6 | 523.3 | 749.3 | 829.5 | 1,305.5 |
| 1995 | 1,442.2 | 1,903.1 | 1,137.4 | 659.3 | 424.0 | 366.1 | 264.4 | 441.7 | 428.7 | 673.6 | 1,075.9 | 1,653.1 |
| 1996 | 2,273.8 | 2,029.6 | 1,393.5 | 972.7 | 452.2 | 389.8 | 310.4 | 405.8 | 501.2 | 842.6 | 1,108.2 | 1,493.4 |
| 1997 | 1,817.9 | 1,423.5 | 958.5 | 741.9 | 434.5 | 350.5 | 420.2 | 406.3 | 630.3 | 644.2 | 1,015.4 | 1,291.8 |
| 1998 | 1,274.0 | 973.8 | 844.1 | 465.5 | 352.8 | 609.6 | 332.2 | 374.0 | 382.2 | 426.9 | 711.6 | 1,016.1 |
| 1999 | 1,110.8 | 827.8 | 918.7 | 476.0 | 385.7 | 390.3 | 374.5 | 379.4 | 385.6 | 603.6 | 1,772.0 | 1,049.4 |
| 2000 | 1,246.2 | 1,257.0 | 976.6 | 453.8 | 363.1 | 313.0 | 244.5 | 408.8 | 368.2 | 545.0 | 821.1 | 1,476.7 |
| 2001 | 1,483.7 | 1,588.3 | 1,066.0 | 693.2 | 516.2 | 402.2 | 438.5 | 391.3 | 560.1 | 627.0 | 676.3 | 874.0 |
| 2002 | 1,169.3 | 915.8 | 631.9 | 425.5 | 363.7 | 305.5 | 394.3 | 422.6 | 343.7 | 563.6 | 743.4 | 1,355.1 |
| 2003 | 1,794.0 | 1,659.9 | 1,252.2 | 713.9 | 437.6 | 388.7 | 342.2 | 344.7 | 503.6 | 661.7 | 674.2 | 1,213.0 |
| 2004 | 1,772.1 | 1,790.7 | 988.1 | 661.7 | 433.8 | 395.4 | 337.0 | 399.9 | 446.0 | 572.6 | 755.9 | 1,075.7 |
| 2005 | 1,244.0 | 1,297.5 | 1,056.9 | 469.4 | 377.9 | 343.7 | 296.0 | 462.1 | 604.0 | 793.3 | 842.0 | 1,254.1 |
| 2006 | 1,080.4 | 932.7 | 729.5 | 401.1 | 400.7 | 246.6 | 287.6 | 412.1 | 349.5 | 425.8 | 630.6 | 720.4 |
| 2007 | 840.8 | 1,364.9 | 895.6 | 539.1 | 291.6 | 306.1 | 389.6 | 492.9 | 571.8 | 564.3 | 496.2 | 604.3 |
| 2008 | 850.0 | 843.0 | 532.4 | 355.7 | 144.2 | 200.8 | 111.2 | 258.4 | 177.5 | 367.9 | 636.4 | 782.6 |
| 2009 | 929.6 | 805.4 | 684.1 | 310.4 | 133.2 | 95.0 | W | 62.5 | 147.6 | 303.1 | 347.3 | 665.0 |
| 2010 | 903.7 | 879.5 | 448.8 | 162.3 | 160.3 | 115.9 | 117.4 | 153.9 | 106.2 | NA | 360.2 | 869.5 |
| 2011 | 943.9 | 801.1 | 466.9 | 227.1 | 66.3 | 73.9 | W | 89.4 | 149.8 | 197.4 | 373.5 | 358.1 |
| 2012 | 530.5 | 462.1 | 196.5 | 152.1 | 98.2 | W | 88.5 | 72.4 | 96.6 | 190.7 | 469.0 | 409.7 |
| 2013 | 595.4 | 614.5 | 426.4 | 247.2 | 98.5 | 80.9 | 100.8 | 90.6 | 124.5 | 262.1 | 394.5 | 466.0 |
| 2014 | 913.5 | 810.5 | 573.3 | 245.2 | 91.3 | 92.5 | W | 101.6 | 132.1 | 239.2 | 475.2 | 526.3 |
| 2015 | 626.0 | 762.2 | 599.6 | 177.1 | W | W | 80.1 | 160.0 | 199.8 | 347.4 | 300.8 | 344.7 |
| 2016 | 509.4 | 571.3 | 329.3 | 214.0 | 163.2 | 95.5 | 66.4 | 91.7 | 149.6 | 226.9 | 239.8 | 416.8 |
| 2017 | 494.2 | 392.0 | 334.6 | 100.4 | 63.8 | 54.9 | 80.7 | 106.8 | 60.5 | 121.4 | 341.9 | 492.6 |
| 2018 | 827.8 | 535.6 | 434.9 | 219.5 | 126.1 | 96.8 | 53.2 | W | 131.1 | 235.5 | 438.2 | 550.8 |
| 2019 | 666.2 | 648.8 | 336.1 | 127.2 | W | 96.2 | 44.5 | 60.6 | 77.8 | 179.3 | 404.2 | 517.0 |
| 2020 | 556.9 | 504.7 | 301.4 | 252.6 | 245.1 | 53.9 | 42.6 | 45.6 | 130.0 | 140.9 | 227.7 | 531.8 |
| 2021 | 557.1 | 602.7 | 376.3 | 133.4 | 101.6 | 73.0 | 39.5 | 67.5 | 81.6 | 173.7 | 333.8 | 450.6 |
| 2022 | 533.2 | 614.3 | 326.7 | |||||||||
| - = No Data Reported; -- = Not Applicable; NA = Not Available; W = Withheld to avoid disclosure of individual company data. |
| Release Date: 5/19/2022 |
| Next Release Date: TBD |