|
Download Data (XLS File) |
|
||||||||
|
||||||||
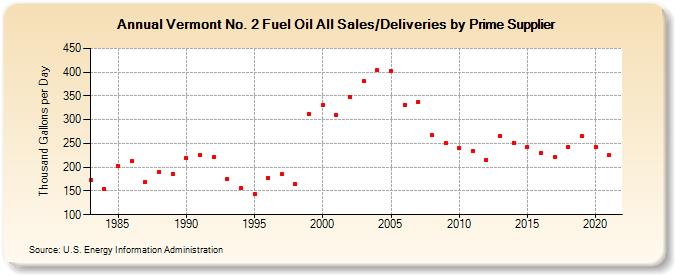
| Vermont No. 2 Fuel Oil All Sales/Deliveries by Prime Supplier (Thousand Gallons per Day) | ||||||||
| Decade | Year-0 | Year-1 | Year-2 | Year-3 | Year-4 | Year-5 | Year-6 | Year-7 | Year-8 | Year-9 |
|---|---|---|---|---|---|---|---|---|---|---|
| 1980's | 172.7 | 154.0 | 202.9 | 212.7 | 168.4 | 190.1 | 185.5 | |||
| 1990's | 219.1 | 224.8 | 221.2 | 175.6 | 156.0 | 144.1 | 178.2 | 185.6 | 164.6 | 311.4 |
| 2000's | 331.1 | 310.2 | 348.6 | 381.0 | 403.8 | 402.9 | 331.4 | 337.9 | 267.0 | 250.8 |
| 2010's | 240.9 | 233.3 | 215.8 | 265.8 | 251.7 | 242.2 | 229.3 | 220.4 | 242.1 | 265.1 |
| 2020's | 242.2 |
| - = No Data Reported; -- = Not Applicable; NA = Not Available; W = Withheld to avoid disclosure of individual company data. |
| Release Date: 6/1/2022 |
| Next Release Date: TBD |