|
Download Data (XLS File) |
|
||||||||
|
||||||||
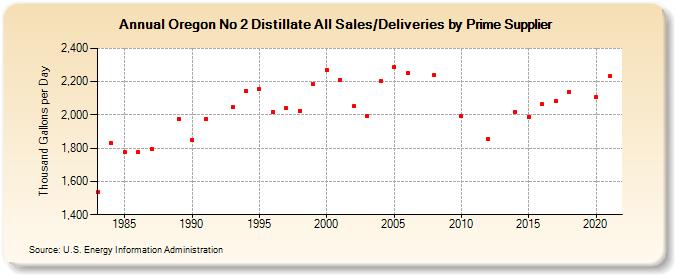
| Oregon No 2 Distillate All Sales/Deliveries by Prime Supplier (Thousand Gallons per Day) | ||||||||
| Decade | Year-0 | Year-1 | Year-2 | Year-3 | Year-4 | Year-5 | Year-6 | Year-7 | Year-8 | Year-9 |
|---|---|---|---|---|---|---|---|---|---|---|
| 1980's | 1,537.4 | 1,830.8 | 1,775.1 | 1,775.6 | 1,795.5 | W | 1,977.7 | |||
| 1990's | 1,850.5 | 1,976.3 | W | 2,045.2 | 2,145.5 | 2,153.9 | 2,017.7 | 2,041.4 | 2,025.5 | 2,183.1 |
| 2000's | 2,272.0 | 2,210.0 | 2,050.8 | 1,993.4 | 2,204.5 | 2,285.4 | 2,251.3 | W | 2,241.5 | W |
| 2010's | 1,993.5 | W | 1,852.3 | W | 2,020.2 | 1,986.9 | 2,064.8 | 2,083.9 | 2,138.4 | W |
| 2020's | 2,105.5 |
| - = No Data Reported; -- = Not Applicable; NA = Not Available; W = Withheld to avoid disclosure of individual company data. |
| Release Date: 6/1/2022 |
| Next Release Date: TBD |