|
Download Data (XLS File) |
|
||||||||
|
||||||||
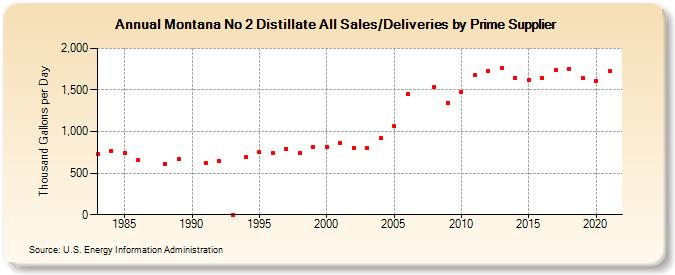
| Montana No 2 Distillate All Sales/Deliveries by Prime Supplier (Thousand Gallons per Day) | ||||||||
| Decade | Year-0 | Year-1 | Year-2 | Year-3 | Year-4 | Year-5 | Year-6 | Year-7 | Year-8 | Year-9 |
|---|---|---|---|---|---|---|---|---|---|---|
| 1980's | 732.2 | 770.1 | 738.9 | 655.7 | W | 608.1 | 664.8 | |||
| 1990's | W | 626.2 | 645.8 | 0.0 | 690.1 | 749.2 | 742.9 | 796.1 | 745.6 | 817.7 |
| 2000's | 817.2 | 858.4 | 805.7 | 796.5 | 922.8 | 1,061.9 | 1,456.8 | W | 1,535.9 | 1,344.8 |
| 2010's | 1,473.1 | 1,677.4 | 1,725.7 | 1,767.2 | 1,647.8 | 1,622.5 | 1,647.6 | 1,735.0 | 1,757.2 | 1,642.0 |
| 2020's | 1,610.7 |
| - = No Data Reported; -- = Not Applicable; NA = Not Available; W = Withheld to avoid disclosure of individual company data. |
| Release Date: 6/1/2022 |
| Next Release Date: TBD |