|
Download Data (XLS File) |
|
||||||||
|
||||||||
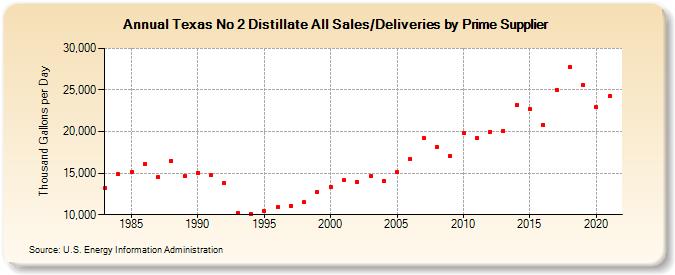
| Texas No 2 Distillate All Sales/Deliveries by Prime Supplier (Thousand Gallons per Day) | ||||||||
| Decade | Year-0 | Year-1 | Year-2 | Year-3 | Year-4 | Year-5 | Year-6 | Year-7 | Year-8 | Year-9 |
|---|---|---|---|---|---|---|---|---|---|---|
| 1980's | 13,182.8 | 14,879.0 | 15,122.8 | 16,068.2 | 14,515.0 | 16,489.7 | 14,602.8 | |||
| 1990's | 15,031.4 | 14,733.5 | 13,757.8 | 10,222.4 | 10,137.7 | 10,420.6 | 10,952.6 | 11,083.4 | 11,484.1 | 12,727.9 |
| 2000's | 13,328.3 | 14,131.0 | 13,956.1 | 14,608.1 | 14,111.0 | 15,093.1 | 16,725.9 | 19,224.6 | 18,176.1 | 17,058.4 |
| 2010's | 19,790.0 | 19,250.3 | 19,983.7 | 20,122.9 | 23,209.6 | 22,659.4 | 20,836.4 | 25,008.3 | 27,767.7 | 25,541.2 |
| 2020's | 22,896.6 |
| - = No Data Reported; -- = Not Applicable; NA = Not Available; W = Withheld to avoid disclosure of individual company data. |
| Release Date: 6/1/2022 |
| Next Release Date: TBD |