|
Download Data (XLS File) |
|
||||||||
|
||||||||
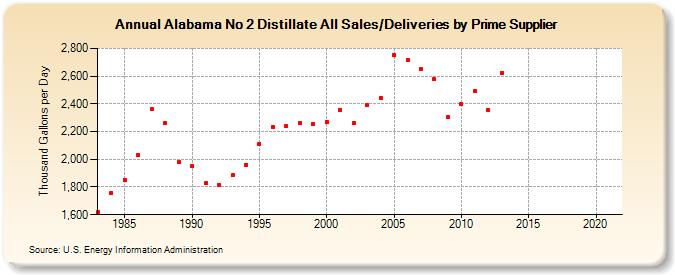
| Alabama No 2 Distillate All Sales/Deliveries by Prime Supplier (Thousand Gallons per Day) | ||||||||
| Decade | Year-0 | Year-1 | Year-2 | Year-3 | Year-4 | Year-5 | Year-6 | Year-7 | Year-8 | Year-9 |
|---|---|---|---|---|---|---|---|---|---|---|
| 1980's | 1,616.2 | 1,755.2 | 1,851.4 | 2,032.4 | 2,365.0 | 2,262.5 | 1,978.4 | |||
| 1990's | 1,953.0 | 1,826.0 | 1,815.1 | 1,886.4 | 1,961.2 | 2,112.0 | 2,235.4 | 2,238.4 | 2,264.1 | 2,255.5 |
| 2000's | 2,271.4 | 2,358.9 | 2,262.8 | 2,390.9 | 2,443.0 | 2,749.9 | 2,714.8 | 2,649.1 | 2,576.2 | 2,307.9 |
| 2010's | 2,399.2 | 2,495.3 | 2,355.0 | 2,625.4 | W | W | W | W | W | W |
| 2020's | W |
| - = No Data Reported; -- = Not Applicable; NA = Not Available; W = Withheld to avoid disclosure of individual company data. |
| Release Date: 6/1/2022 |
| Next Release Date: TBD |