|
Download Data (XLS File) |
|
||||||||
|
||||||||
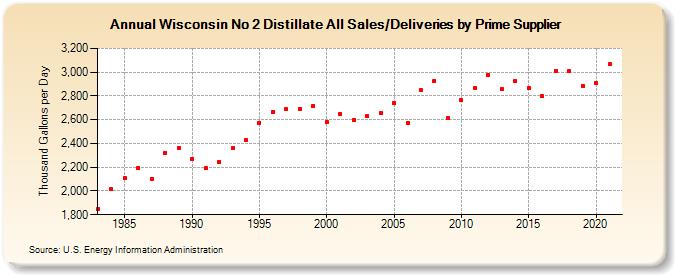
| Wisconsin No 2 Distillate All Sales/Deliveries by Prime Supplier (Thousand Gallons per Day) | ||||||||
| Decade | Year-0 | Year-1 | Year-2 | Year-3 | Year-4 | Year-5 | Year-6 | Year-7 | Year-8 | Year-9 |
|---|---|---|---|---|---|---|---|---|---|---|
| 1980's | 1,846.4 | 2,013.1 | 2,112.8 | 2,191.0 | 2,103.5 | 2,318.8 | 2,364.7 | |||
| 1990's | 2,265.2 | 2,191.0 | 2,247.2 | 2,358.7 | 2,431.6 | 2,574.2 | 2,668.4 | 2,686.0 | 2,693.3 | 2,717.8 |
| 2000's | 2,581.1 | 2,651.6 | 2,600.2 | 2,629.8 | 2,655.8 | 2,739.8 | 2,570.6 | 2,845.8 | 2,928.5 | 2,617.8 |
| 2010's | 2,762.6 | 2,868.4 | 2,974.1 | 2,858.4 | 2,923.5 | 2,866.1 | 2,797.5 | 3,012.0 | 3,011.2 | 2,884.6 |
| 2020's | 2,906.5 |
| - = No Data Reported; -- = Not Applicable; NA = Not Available; W = Withheld to avoid disclosure of individual company data. |
| Release Date: 6/1/2022 |
| Next Release Date: TBD |