|
Download Data (XLS File) |
|
||||||||
|
||||||||
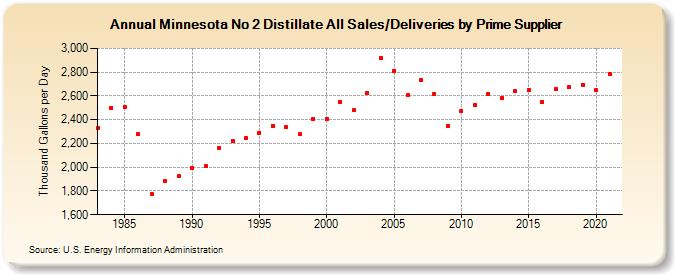
| Minnesota No 2 Distillate All Sales/Deliveries by Prime Supplier (Thousand Gallons per Day) | ||||||||
| Decade | Year-0 | Year-1 | Year-2 | Year-3 | Year-4 | Year-5 | Year-6 | Year-7 | Year-8 | Year-9 |
|---|---|---|---|---|---|---|---|---|---|---|
| 1980's | 2,332.6 | 2,499.6 | 2,502.9 | 2,276.9 | 1,775.4 | 1,880.2 | 1,924.2 | |||
| 1990's | 1,996.9 | 2,006.8 | 2,161.8 | 2,221.0 | 2,247.1 | 2,290.3 | 2,350.0 | 2,335.0 | 2,275.5 | 2,407.4 |
| 2000's | 2,409.3 | 2,549.5 | 2,478.9 | 2,628.6 | 2,915.2 | 2,810.4 | 2,604.4 | 2,731.8 | 2,613.3 | 2,348.2 |
| 2010's | 2,472.2 | 2,520.5 | 2,616.5 | 2,582.9 | 2,638.8 | 2,647.4 | 2,548.8 | 2,658.7 | 2,672.3 | 2,695.1 |
| 2020's | 2,646.4 |
| - = No Data Reported; -- = Not Applicable; NA = Not Available; W = Withheld to avoid disclosure of individual company data. |
| Release Date: 6/1/2022 |
| Next Release Date: TBD |