|
Download Data (XLS File) |
|
||||||||
|
||||||||
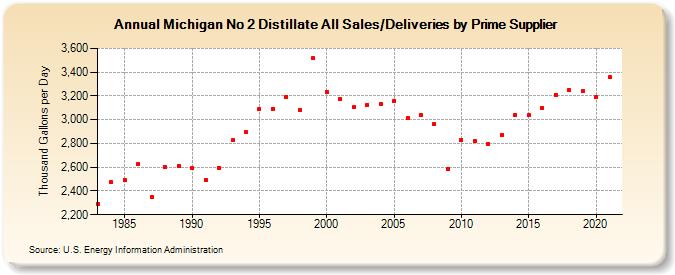
| Michigan No 2 Distillate All Sales/Deliveries by Prime Supplier (Thousand Gallons per Day) | ||||||||
| Decade | Year-0 | Year-1 | Year-2 | Year-3 | Year-4 | Year-5 | Year-6 | Year-7 | Year-8 | Year-9 |
|---|---|---|---|---|---|---|---|---|---|---|
| 1980's | 2,292.4 | 2,471.2 | 2,494.2 | 2,626.4 | 2,349.2 | 2,600.6 | 2,612.0 | |||
| 1990's | 2,592.5 | 2,494.2 | 2,597.2 | 2,826.0 | 2,892.6 | 3,091.5 | 3,093.2 | 3,194.6 | 3,081.1 | 3,515.4 |
| 2000's | 3,235.9 | 3,176.6 | 3,103.0 | 3,124.3 | 3,131.5 | 3,159.4 | 3,012.6 | 3,038.6 | 2,962.8 | 2,581.9 |
| 2010's | 2,832.6 | 2,817.7 | 2,796.8 | 2,874.5 | 3,040.5 | 3,035.5 | 3,099.8 | 3,211.8 | 3,247.8 | 3,240.6 |
| 2020's | 3,187.1 |
| - = No Data Reported; -- = Not Applicable; NA = Not Available; W = Withheld to avoid disclosure of individual company data. |
| Release Date: 6/1/2022 |
| Next Release Date: TBD |