|
Download Data (XLS File) |
|
||||||||
|
||||||||
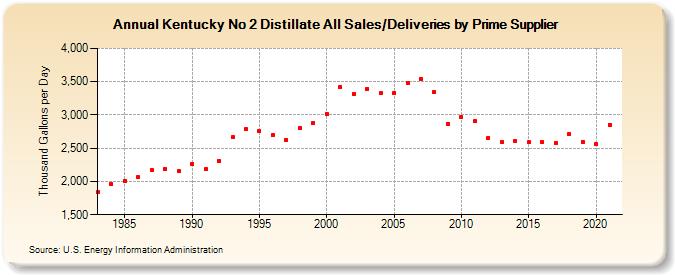
| Kentucky No 2 Distillate All Sales/Deliveries by Prime Supplier (Thousand Gallons per Day) | ||||||||
| Decade | Year-0 | Year-1 | Year-2 | Year-3 | Year-4 | Year-5 | Year-6 | Year-7 | Year-8 | Year-9 |
|---|---|---|---|---|---|---|---|---|---|---|
| 1980's | 1,844.9 | 1,963.2 | 2,011.2 | 2,061.4 | 2,172.2 | 2,186.9 | 2,155.9 | |||
| 1990's | 2,265.1 | 2,182.4 | 2,313.4 | 2,662.9 | 2,784.4 | 2,753.6 | 2,700.1 | 2,625.6 | 2,802.5 | 2,879.8 |
| 2000's | 3,018.3 | 3,417.2 | 3,318.9 | 3,393.5 | 3,323.3 | 3,328.2 | 3,483.4 | 3,541.5 | 3,341.5 | 2,863.6 |
| 2010's | 2,969.2 | 2,901.2 | 2,655.1 | 2,594.0 | 2,610.0 | 2,587.8 | 2,595.6 | 2,580.6 | 2,712.7 | 2,600.4 |
| 2020's | 2,563.6 |
| - = No Data Reported; -- = Not Applicable; NA = Not Available; W = Withheld to avoid disclosure of individual company data. |
| Release Date: 6/1/2022 |
| Next Release Date: TBD |