|
Download Data (XLS File) |
|
||||||||
|
||||||||
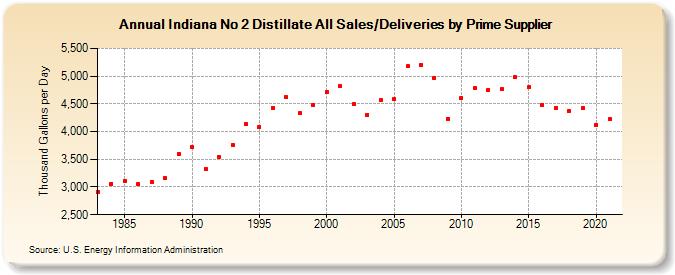
| Indiana No 2 Distillate All Sales/Deliveries by Prime Supplier (Thousand Gallons per Day) | ||||||||
| Decade | Year-0 | Year-1 | Year-2 | Year-3 | Year-4 | Year-5 | Year-6 | Year-7 | Year-8 | Year-9 |
|---|---|---|---|---|---|---|---|---|---|---|
| 1980's | 2,910.1 | 3,061.7 | 3,116.4 | 3,050.7 | 3,093.6 | 3,154.6 | 3,598.3 | |||
| 1990's | 3,715.9 | 3,332.1 | 3,544.0 | 3,760.3 | 4,135.3 | 4,081.9 | 4,431.6 | 4,619.0 | 4,326.1 | 4,471.0 |
| 2000's | 4,712.8 | 4,813.6 | 4,491.3 | 4,305.2 | 4,561.8 | 4,581.2 | 5,176.8 | 5,206.4 | 4,972.1 | 4,234.1 |
| 2010's | 4,613.4 | 4,785.5 | 4,753.5 | 4,766.8 | 4,980.2 | 4,794.9 | 4,479.0 | 4,416.8 | 4,367.2 | 4,419.6 |
| 2020's | 4,124.9 |
| - = No Data Reported; -- = Not Applicable; NA = Not Available; W = Withheld to avoid disclosure of individual company data. |
| Release Date: 6/1/2022 |
| Next Release Date: TBD |