|
Download Data (XLS File) |
|
||||||||
|
||||||||
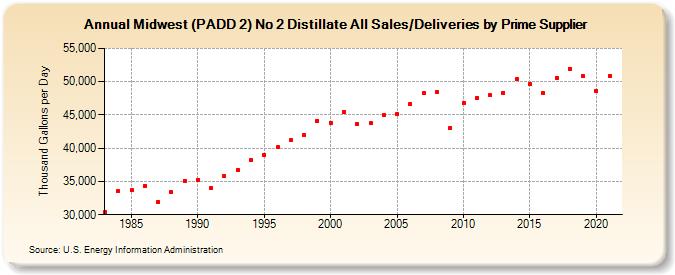
| Midwest (PADD 2) No 2 Distillate All Sales/Deliveries by Prime Supplier (Thousand Gallons per Day) | ||||||||
| Decade | Year-0 | Year-1 | Year-2 | Year-3 | Year-4 | Year-5 | Year-6 | Year-7 | Year-8 | Year-9 |
|---|---|---|---|---|---|---|---|---|---|---|
| 1980's | 30,392.6 | 33,556.0 | 33,699.4 | 34,322.0 | 31,976.8 | 33,347.4 | 35,120.6 | |||
| 1990's | 35,196.6 | 33,979.2 | 35,859.4 | 36,773.1 | 38,195.4 | 39,002.9 | 40,112.1 | 41,168.0 | 41,969.1 | 44,133.2 |
| 2000's | 43,846.4 | 45,440.3 | 43,609.9 | 43,755.8 | 44,940.4 | 45,135.7 | 46,641.2 | 48,295.2 | 48,461.0 | 43,078.6 |
| 2010's | 46,718.3 | 47,614.2 | 47,932.0 | 48,344.3 | 50,350.3 | 49,699.8 | 48,238.7 | 50,611.7 | 51,954.9 | 50,809.2 |
| 2020's | 48,641.2 |
| - = No Data Reported; -- = Not Applicable; NA = Not Available; W = Withheld to avoid disclosure of individual company data. |
| Release Date: 6/1/2022 |
| Next Release Date: TBD |