|
Download Data (XLS File) |
|
||||||||
|
||||||||
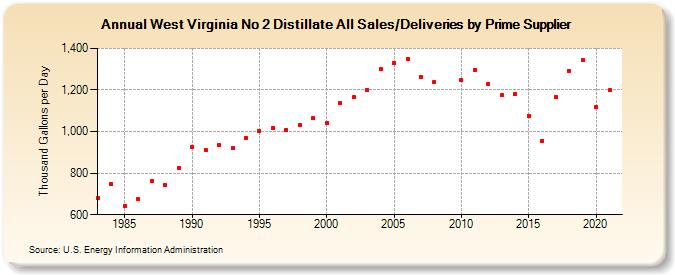
| West Virginia No 2 Distillate All Sales/Deliveries by Prime Supplier (Thousand Gallons per Day) | ||||||||
| Decade | Year-0 | Year-1 | Year-2 | Year-3 | Year-4 | Year-5 | Year-6 | Year-7 | Year-8 | Year-9 |
|---|---|---|---|---|---|---|---|---|---|---|
| 1980's | 679.5 | 748.4 | 642.4 | 674.7 | 763.3 | 741.1 | 822.8 | |||
| 1990's | 925.7 | 911.4 | 934.6 | 920.3 | 970.7 | 1,002.6 | 1,018.5 | 1,007.7 | 1,032.2 | 1,063.4 |
| 2000's | 1,041.0 | 1,135.4 | 1,164.0 | 1,201.0 | 1,299.2 | 1,331.6 | 1,349.5 | 1,264.1 | 1,239.3 | W |
| 2010's | 1,246.4 | 1,297.4 | 1,227.8 | 1,174.0 | 1,178.8 | 1,075.0 | 955.2 | 1,166.6 | 1,293.3 | 1,343.0 |
| 2020's | 1,116.8 |
| - = No Data Reported; -- = Not Applicable; NA = Not Available; W = Withheld to avoid disclosure of individual company data. |
| Release Date: 6/1/2022 |
| Next Release Date: TBD |